Unlock a world of possibilities! Login now and discover the exclusive benefits awaiting you.
- Qlik Community
- :
- All Forums
- :
- QlikView
- :
- Total average time calculation by day and month in...
- Subscribe to RSS Feed
- Mark Topic as New
- Mark Topic as Read
- Float this Topic for Current User
- Bookmark
- Subscribe
- Mute
- Printer Friendly Page
- Mark as New
- Bookmark
- Subscribe
- Mute
- Subscribe to RSS Feed
- Permalink
- Report Inappropriate Content
Total average time calculation by day and month intervals
Hi,
I need to create a stacked bar chart (similar to the image below which is not in Qv) to show the time (in average) spent by a process across a workflow.
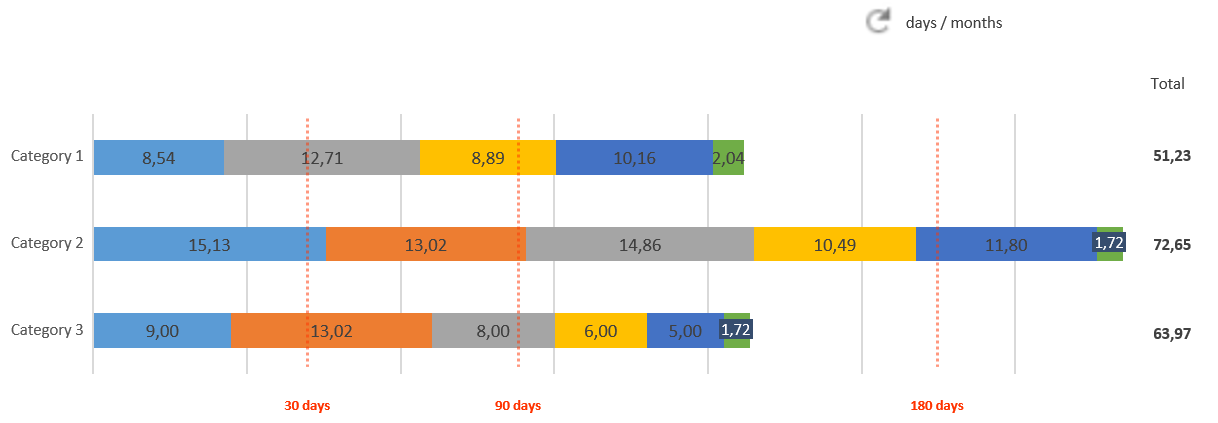
Note: The image is an example from a ppt presentation.
The goal is to measure the time spent in each status considering the Start Date and End Date are the transition dates, e.g. Start Date is the date when the process reach the status and End Date is when the process change and pass to the next status.
Please find attach an example of some sample data.
I also need to have a control that allows the visualization of the information by time intervals like the following:
30 days >> 1 month
60 days >> 2 months
180 days >> 6 months
E.g. If we choose in days we will have the calculation in days and see the reference lines in days (30, 60, 90 days) if we choose months we have the same representation but in months (1,2,6, months).
Could anyone help me with this challenge?
You’re help are welcome and appreciated.
Many thanks
Regards
Paulo
- Mark as New
- Bookmark
- Subscribe
- Mute
- Subscribe to RSS Feed
- Permalink
- Report Inappropriate Content
Hi
Do you need the time spent in days or hours ?
your quote:
The goal is to measure the time spent in each status considering the Start Date and End Date are the transition dates, e.g. Start Date is the date when the process reach the status and End Date is when the process change and pass to the next status
- Mark as New
- Bookmark
- Subscribe
- Mute
- Subscribe to RSS Feed
- Permalink
- Report Inappropriate Content
Hi,
The idea is to have, by default, the time spent in days and a button or a control that allow the user to change to swithc between the time spent in days and months.
Thanks
Regards
Paulo
- Mark as New
- Bookmark
- Subscribe
- Mute
- Subscribe to RSS Feed
- Permalink
- Report Inappropriate Content
Not sure about the expressions but worked on the button for days and months.
Please find attached, it may help you.
- Mark as New
- Bookmark
- Subscribe
- Mute
- Subscribe to RSS Feed
- Permalink
- Report Inappropriate Content
Hi,
If I understand correctly you approach, the graph is not showing the days spent by status. Is showing the diffdays.
The calculation that I'm looking for is about the time spent in each status (column Status of the excel shared).
Taking as an example: in status 1 the process spent 3 days, in status 24 it spent 6 days and so fourth. Saying this, the graph should show in the stacked bars the total time spent by status and by category days (by default) and if the user select months, the total time spent in months again for each status.
Thanks
Regards
Paulo
- Mark as New
- Bookmark
- Subscribe
- Mute
- Subscribe to RSS Feed
- Permalink
- Report Inappropriate Content
Hi,
Anyone to help me on this thread?
Any help are welcome and appreciated.
Thanks in advance
Regards
Paulo