Unlock a world of possibilities! Login now and discover the exclusive benefits awaiting you.
- Qlik Community
- :
- All Forums
- :
- QlikView App Dev
- :
- Totals don't match ?After adding up values of indi...
- Subscribe to RSS Feed
- Mark Topic as New
- Mark Topic as Read
- Float this Topic for Current User
- Bookmark
- Subscribe
- Mute
- Printer Friendly Page
- Mark as New
- Bookmark
- Subscribe
- Mute
- Subscribe to RSS Feed
- Permalink
- Report Inappropriate Content
Totals don't match ?After adding up values of individuals selections.
Hi,
I have a table.
The totals are incorrect.
example
1) I select a value F10 from the list box,the chart gives a value of 1,708 (see fig 1) for Jan 2014
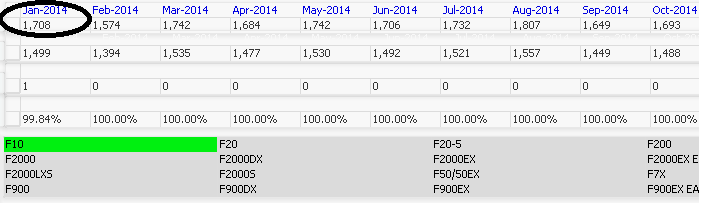
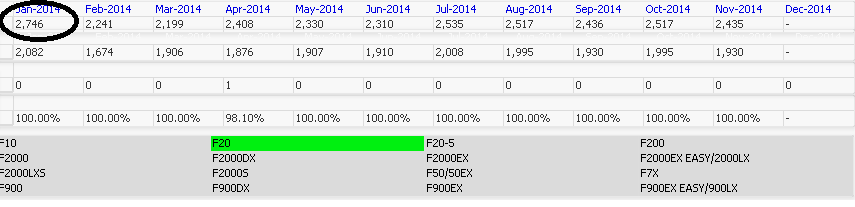
2) I select a value F20 from the list box,the chart gives a value of 2,746 (see fig 1) for Jan 2014
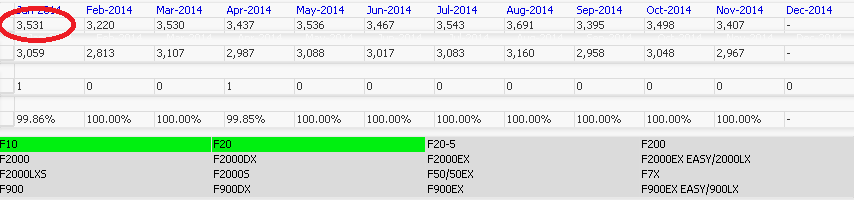
3) On selecting both F10 and F20 I get wrong results , the value should have been 4,452 instead of 3,531
I'm using the following formula in the expression:
(Sum ({<ROLLING_FLAG={1}, AEXISTS={'Y'}, E_FLAG={'Y'}>}AVG_HRS_PM_FLIGHT)
/ COUNT({< ROLLING_FLAG={1}, AEXISTS={'Y'}, E_FLAG={'Y'}>} AC_SERIAL)
* COUNT({<ROLLING_FLAG={1}>}AC_SERIAL))
Why is the expression behaving strangely?
SM
Accepted Solutions
- Mark as New
- Bookmark
- Subscribe
- Mute
- Subscribe to RSS Feed
- Permalink
- Report Inappropriate Content
Fixed it by using the Aggr function
SUM(
AGGR(
(Sum ({<ROLLING_FLAG={1}, AEXISTS={'Y'}, E_FLAG={'Y'}>}AVG_HRS_PM_FLIGHT)
/ COUNT({< ROLLING_FLAG={1}, AEXISTS={'Y'}, E_FLAG={'Y'}>} AC_SERIAL)
* COUNT({<ROLLING_FLAG={1}>}AC_SERIAL)),
MY_DIMENSIONS))
- Mark as New
- Bookmark
- Subscribe
- Mute
- Subscribe to RSS Feed
- Permalink
- Report Inappropriate Content
My guess is that some values belong to both F10 and F20? Counting them only once is correct QV behavior. If instead you want the "sum of rows", you can get that with an aggr() as you have done.
-Rob