Unlock a world of possibilities! Login now and discover the exclusive benefits awaiting you.
- Qlik Community
- :
- All Forums
- :
- QlikView App Dev
- :
- Re: Totals in bar graphs by dimension data
- Subscribe to RSS Feed
- Mark Topic as New
- Mark Topic as Read
- Float this Topic for Current User
- Bookmark
- Subscribe
- Mute
- Printer Friendly Page
- Mark as New
- Bookmark
- Subscribe
- Mute
- Subscribe to RSS Feed
- Permalink
- Report Inappropriate Content
Totals in bar graphs by dimension data
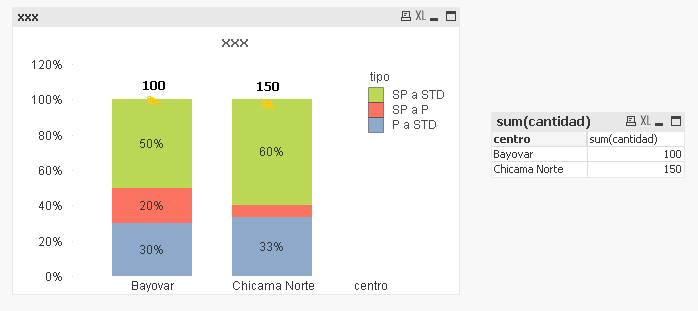
Hello everyone, please support for the next need. It is possible to put the totals for each center at the top of the bar. As it is displayed in the image. Attachment qvw file.

- « Previous Replies
-
- 1
- 2
- Next Replies »
Accepted Solutions
- Mark as New
- Bookmark
- Subscribe
- Mute
- Subscribe to RSS Feed
- Permalink
- Report Inappropriate Content
Just use the Dual() in the last (total) expression. See attached.
-Rob
- Mark as New
- Bookmark
- Subscribe
- Mute
- Subscribe to RSS Feed
- Permalink
- Report Inappropriate Content
Hi,
Is this an extension object ?
- Mark as New
- Bookmark
- Subscribe
- Mute
- Subscribe to RSS Feed
- Permalink
- Report Inappropriate Content
Hi!!
Try this out!!
- Right click on the chart object
- Click chart properties -> Presentation tab -> check Still show totals on top check box
Hope this works!!
- Mark as New
- Bookmark
- Subscribe
- Mute
- Subscribe to RSS Feed
- Permalink
- Report Inappropriate Content
Hi Chritopher,
It is not an extension object
- Mark as New
- Bookmark
- Subscribe
- Mute
- Subscribe to RSS Feed
- Permalink
- Report Inappropriate Content
Hello Jothimala,
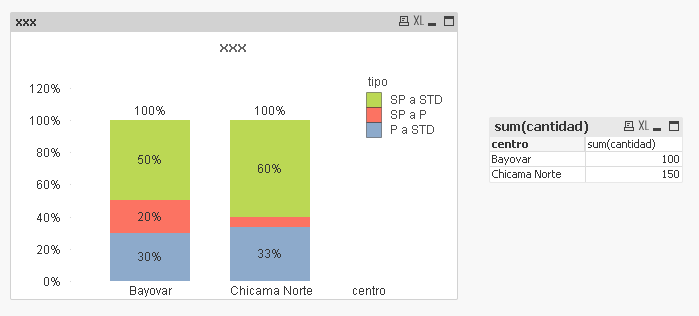
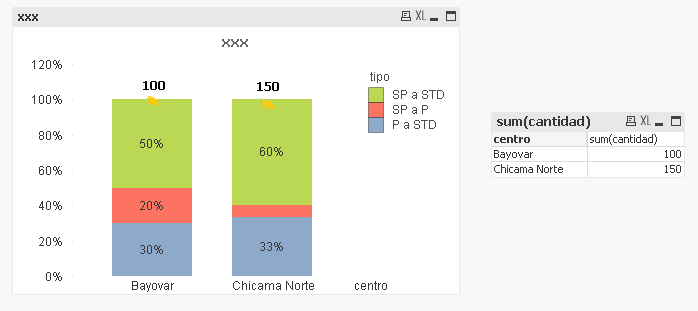
I did what you told me but it's not what I need. I get the percentage values but I need to leave the values as quantity, similar to the first image I shared.
I do not need this:

I need this:

- Mark as New
- Bookmark
- Subscribe
- Mute
- Subscribe to RSS Feed
- Permalink
- Report Inappropriate Content
Not sure if this is possible as it is not straight forward option to display as the axis has %ges but you want the totals to be in the graph. May be check if below work around works for you? If yes check attached.
- Mark as New
- Bookmark
- Subscribe
- Mute
- Subscribe to RSS Feed
- Permalink
- Report Inappropriate Content
Hi Vishwarath,
On the axes if it is possible to do that, if you knew the solution but the need is to put it on top. Apparently the graphic does not allow you to put it on top. Any idea please
- Mark as New
- Bookmark
- Subscribe
- Mute
- Subscribe to RSS Feed
- Permalink
- Report Inappropriate Content
I have no other idea other than showing it in the text axis. Sorry.
- Mark as New
- Bookmark
- Subscribe
- Mute
- Subscribe to RSS Feed
- Permalink
- Report Inappropriate Content
Thanks friend for the support, I hope there is some other solution but no way
- Mark as New
- Bookmark
- Subscribe
- Mute
- Subscribe to RSS Feed
- Permalink
- Report Inappropriate Content
May be lets here from rwunderlich stalwar1 marcowedel if any ideas.
- « Previous Replies
-
- 1
- 2
- Next Replies »