Unlock a world of possibilities! Login now and discover the exclusive benefits awaiting you.
- Qlik Community
- :
- All Forums
- :
- QlikView App Dev
- :
- Tracking Items Over Time
- Subscribe to RSS Feed
- Mark Topic as New
- Mark Topic as Read
- Float this Topic for Current User
- Bookmark
- Subscribe
- Mute
- Printer Friendly Page
- Mark as New
- Bookmark
- Subscribe
- Mute
- Subscribe to RSS Feed
- Permalink
- Report Inappropriate Content
Tracking Items Over Time
Hello everyone,
I am wondering about the best way to handle migration of items in a population. For example, let's say in period 1 I have items A, B, and C. Then in period 2 I have items B, C, and D. Let's say I'm summing some value associated with the items:
Load * Inline [
Period, Item, Value
1, A, 20
1, B, 40
1, C, 50
2, B, 45
2, C, 52
2, D, 61
];
And I want to decompose the change in Value across:
1) Items dropped in period 2
2) New items in period 2
3) Common items between periods
What I have done so far is to use a calculated dimension:
If(SubstringCount(Aggr(Concat(Distinct [Item #] & Period & '|'),[Item #]),[Item #])&Max(Period)&'|'
,If(SubstringCount(Aggr(Concat(Distinct [Item #] & Period & '|'),[Item #]),[Item #])&Min(Period)&'|'
,'Common Item'
,'New Item')
,'Dropped Item')
This works but is very processor intensive. What has everyone else done to solve this problem? I have roughly 2 million unique items across my periods. I was thinking of adding a new dimension that has all the possibilities, like this:
A, In Period 1 not in Period 2
B, In Period 1 and Period 2
C, In Period 1 and Period 2
D, In Period 2 not in Period 1
I'm afraid this will produce many millions of rows, but may be faster than my calculated dimension.
Any ideas?
Accepted Solutions
- Mark as New
- Bookmark
- Subscribe
- Mute
- Subscribe to RSS Feed
- Permalink
- Report Inappropriate Content
for 2 period, I think you can count
source:
Load * Inline [
Period, Item, Value
1, A, 20
1, B, 40
1, C, 50
2, B, 45
2, C, 52
2, D, 61
];
Left join (source) load
Item, count(Item) as cnt
Resident source
group by Item;
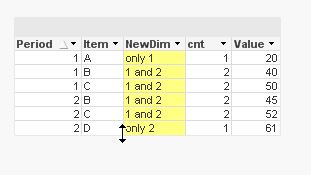
left Join (source) load *,
if(cnt=2, '1 and 2', 'only ' & Period) as NewDim
Resident source;
- Mark as New
- Bookmark
- Subscribe
- Mute
- Subscribe to RSS Feed
- Permalink
- Report Inappropriate Content
for 2 period, I think you can count
source:
Load * Inline [
Period, Item, Value
1, A, 20
1, B, 40
1, C, 50
2, B, 45
2, C, 52
2, D, 61
];
Left join (source) load
Item, count(Item) as cnt
Resident source
group by Item;
left Join (source) load *,
if(cnt=2, '1 and 2', 'only ' & Period) as NewDim
Resident source;
- Mark as New
- Bookmark
- Subscribe
- Mute
- Subscribe to RSS Feed
- Permalink
- Report Inappropriate Content
Hi Massimo,
That is a great idea. You've inspired me to look at multiple periods:
ItemMigrationDim:
LOAD * Inline [Item];
NoConcatenate
source:
Load * Inline [
Period, Item, Value
1, A, 20
1, B, 40
1, C, 50
2, B, 45
2, C, 52
2, D, 61
3, A, 15
3, C, 20
3, D, 18
3, E, 85
];
NoConcatenate
PeriodsTemp:
LOAD Distinct Period Resident source;
NoConcatenate
Periods:
LOAD Period Resident PeriodsTemp Order by Period;
drop table PeriodsTemp;
FOR i = 0 to NoOfRows('Periods') - 1
Let vBasePeriod = Peek('Period',i,'Periods');
FOR j = i + 1 to NoOfRows('Periods') - 1
Let vComparisonPeriod = Peek('Period',j,'Periods');
Temp:
LOAD Item, Min(Period) as MinPeriod, Max(Period) as MaxPeriod Resident source Where Period = $(vBasePeriod) or Period = $(vComparisonPeriod) Group By Item;
Concatenate(ItemMigrationDim)
LOAD Item
,If(MinPeriod = $(vComparisonPeriod),$(vComparisonPeriod) & ' not ' & $(vBasePeriod)
,If(MaxPeriod = $(vBasePeriod), $(vBasePeriod) & ' not ' & $(vComparisonPeriod),$(vBasePeriod) & ' and ' & $(vComparisonPeriod)
)
) as MigrationText
,$(vBasePeriod) as BasePeriod
,$(vComparisonPeriod) as ComparisonPeriod
Resident Temp;
drop table Temp;
NEXT
NEXT
DROP Table Periods;
For some reason when I took the distinct on Period it was never in order. I tried adding Order By Period, but it still didn't work, so I had to put it in a temp table.
I made a straight table with this expression:
=Sum({<BasePeriod = {$(=Min(Period))}, ComparisonPeriod = {$(=Max(Period))}>} Value)
That way only the relevant periods show up in the table.