Unlock a world of possibilities! Login now and discover the exclusive benefits awaiting you.
- Qlik Community
- :
- All Forums
- :
- QlikView App Dev
- :
- Re: Traffic Light Gauge not working
- Subscribe to RSS Feed
- Mark Topic as New
- Mark Topic as Read
- Float this Topic for Current User
- Bookmark
- Subscribe
- Mute
- Printer Friendly Page
- Mark as New
- Bookmark
- Subscribe
- Mute
- Subscribe to RSS Feed
- Permalink
- Report Inappropriate Content
Traffic Light Gauge not working
Hi
In one of the column in my straight table I need to display the variation percentage of sales. If the variation is > 40% dial should indicate in green, if less than 10% dial should indicate RED and between Yellow.
when I 3 segments, I am getting 3 gauges !!! Please help
- Mark as New
- Bookmark
- Subscribe
- Mute
- Subscribe to RSS Feed
- Permalink
- Report Inappropriate Content
Find the Attachment it's Simply tricky in Presentation Tab Select Each Segments
May b Helpful
- Mark as New
- Bookmark
- Subscribe
- Mute
- Subscribe to RSS Feed
- Permalink
- Report Inappropriate Content
Hi,
Please check the Gauge settings.
You can check them in Expressions-Gauge Settings as below:
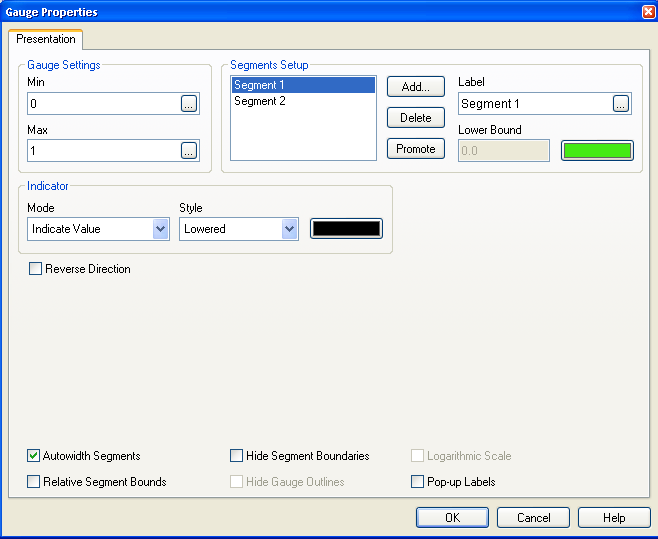
And here you can do the settings as required.
Hope this helps!
If not, then please share a sample app.
- Mark as New
- Bookmark
- Subscribe
- Mute
- Subscribe to RSS Feed
- Permalink
- Report Inappropriate Content
Hi JayaDev,
Are you using minichart?
Please find attached sample application.
HTH
Sushil
- Mark as New
- Bookmark
- Subscribe
- Mute
- Subscribe to RSS Feed
- Permalink
- Report Inappropriate Content
Hi Rohit.
Could not see any attachment, however I got the answer.
Thanks.
- Mark as New
- Bookmark
- Subscribe
- Mute
- Subscribe to RSS Feed
- Permalink
- Report Inappropriate Content
Thanks