Unlock a world of possibilities! Login now and discover the exclusive benefits awaiting you.
- Qlik Community
- :
- All Forums
- :
- QlikView App Dev
- :
- Re: Trailing Chart (One month have one value of pr...
- Subscribe to RSS Feed
- Mark Topic as New
- Mark Topic as Read
- Float this Topic for Current User
- Bookmark
- Subscribe
- Mute
- Printer Friendly Page
- Mark as New
- Bookmark
- Subscribe
- Mute
- Subscribe to RSS Feed
- Permalink
- Report Inappropriate Content
Trailing Chart (One month have one value of previous 12 months)
Hi,
I have a problem relating trailing chart, it's not the roll-owing month (cumulative 12 months ) . Attached is the application I am developing please suggest how can I take the value of each month selected from Month filter to show one value of it's last 12 months. I also created two fields one for today and one for last 12 months for each date.
I want to show the summing amount coming in straight table for selected month(for last 12 months).
Please help me in this regards.
- Mark as New
- Bookmark
- Subscribe
- Mute
- Subscribe to RSS Feed
- Permalink
- Report Inappropriate Content
Hi Muhammad,
Did you find any solution for the above problem.
I am facing a similar problem.
My data looks like this:
Month_Period Amount
Jan 2012 100
Feb 2012 200
Mar 2012 150
Apr 2012 50
May 2012 100
Jun 2012 50
and so I want a trailing 3 months graph or chart should look something like this:
Month_Period Trailing_Amount
Jan 2012 100 [=100+0+0, 0's from previous months]
Feb 2012 300 [=200+100+0]
Mar 2012 450 [=150+200+100]
Apr 2012 400 [=50+150+200]
May 2012 300 [=100+50+150]
Jun 2012 200 [=50+100+50]
Please share if you have made any progress on this problem statement.
Thanks.
- Mark as New
- Bookmark
- Subscribe
- Mute
- Subscribe to RSS Feed
- Permalink
- Report Inappropriate Content
Please try above( sum( Trailing_Amount ), 3 ).
- Mark as New
- Bookmark
- Subscribe
- Mute
- Subscribe to RSS Feed
- Permalink
- Report Inappropriate Content
Please try
Sum({$<
Calendar.MonthNo,
Calendar.Year,
[Month-Year],
Date={$(='">' & Num(AddMonths(Max(Date),-3),'###0') & '<='& Num(Max(Date),'###0') & '"')}
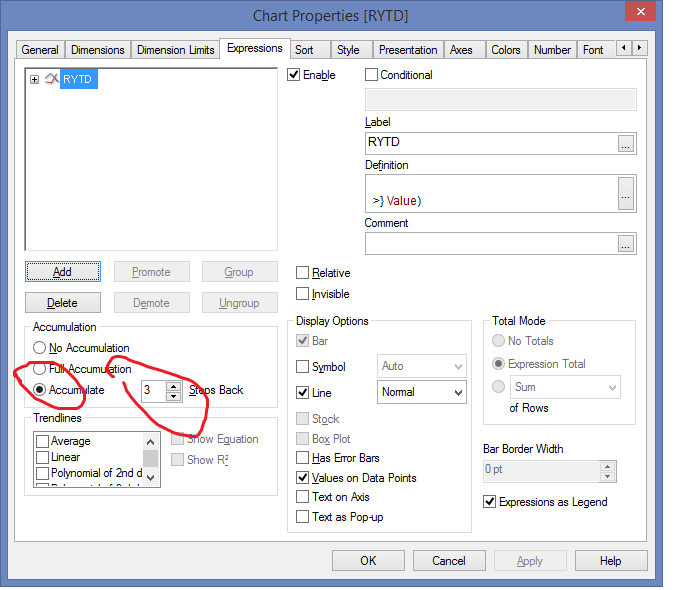
>} Value)
and select Accumulate 3 steps back
You should point out all Date Field in Set Analysis statement which you select. For example Month, Year, etc...
See example attached
Sergey