Unlock a world of possibilities! Login now and discover the exclusive benefits awaiting you.
- Qlik Community
- :
- All Forums
- :
- QlikView App Dev
- :
- Re: Transformation Problem
- Subscribe to RSS Feed
- Mark Topic as New
- Mark Topic as Read
- Float this Topic for Current User
- Bookmark
- Subscribe
- Mute
- Printer Friendly Page
- Mark as New
- Bookmark
- Subscribe
- Mute
- Subscribe to RSS Feed
- Permalink
- Report Inappropriate Content
Transformation Problem
Hi Friends,
Can anyone help me, please?
I am trying to transformation same as Excel into Qlikview. But, It's not getting correct way.
Please Assist me
- ANIL
- Mark as New
- Bookmark
- Subscribe
- Mute
- Subscribe to RSS Feed
- Permalink
- Report Inappropriate Content
Hi,
And your problem is? Do You want it to look as the excelsheet?
- Mark as New
- Bookmark
- Subscribe
- Mute
- Subscribe to RSS Feed
- Permalink
- Report Inappropriate Content
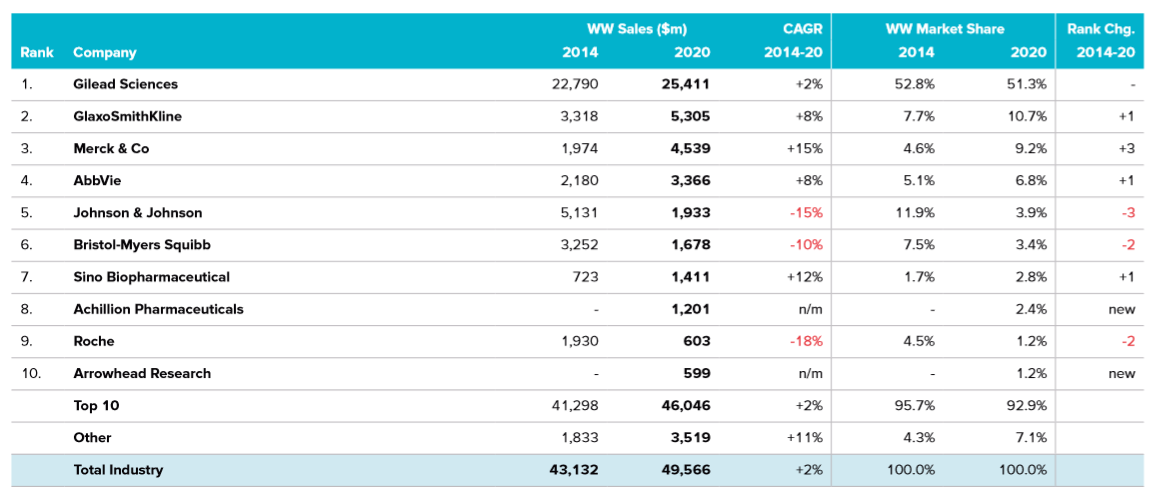
Thanks for attempting on wall, I want same thing in Qlikview. Can you please look for that. The values header should show
| WW Sales ($m) | CAGR | WW Market Share | Rank Chg. | ||
| 2014 | 2020 | 2014-20 | 2014 | 2020 | 2014-20 |
| 6,246 | 7,497 | 3% | 23.40% | 21.60% | 0 |
| 4,480 | 7,440 | 9% | 16.80% | 21.40% | 2 |
| 5,258 | 7,343 | 6% | 19.70% | 21.10% | 0 |
| 5,845 | 7,253 | 4% | 21.90% | 20.90% | -2 |
| 1,537 | 979 | -7% | 5.70% | 2.80% | 0 |
| 246 | 506 | 13% | 0.90% | 1.50% | 6 |
| 315 | 377 | 3% | 1.20% | 1.10% | 1 |
| 399 | 369 | 1% | 1.30% | 1.10% | -2 |
| 295 | 318 | 1% | 1.10% | 0.90% | 1 |
| 272 | 276 | 0% | 1.00% | 0.80% | 1 |
- Mark as New
- Bookmark
- Subscribe
- Mute
- Subscribe to RSS Feed
- Permalink
- Report Inappropriate Content
you are going to need to define separate expression for each column and format them accordingly.
It looks like you are calculating percentage increase decrease aswell as ranking but your data model is very simplistic here in the sample and contains the results.
if you just want to mimic excel then the attached does this but I think in your actual app, you can calculate most the !columns based on the first 2
- Mark as New
- Bookmark
- Subscribe
- Mute
- Subscribe to RSS Feed
- Permalink
- Report Inappropriate Content
Import only company name and two first years column as a cross-table in wizard.
Then create new chart - straight table (or pivot) and calculate everything.
- Mark as New
- Bookmark
- Subscribe
- Mute
- Subscribe to RSS Feed
- Permalink
- Report Inappropriate Content
| Header 1 |
|---|
Hi Anil,
Why don't you edit your Excel sheet this way. It will be easier to load and understand the data.
Let me know your thoughts.
Thanks
Khurram
- Mark as New
- Bookmark
- Subscribe
- Mute
- Subscribe to RSS Feed
- Permalink
- Report Inappropriate Content
Can you please help me on my Application with using my Data. Might this route hearing good one
- Mark as New
- Bookmark
- Subscribe
- Mute
- Subscribe to RSS Feed
- Permalink
- Report Inappropriate Content
Ali & Tracy,
I am expecting this? Might be clear. Now help required..
- Mark as New
- Bookmark
- Subscribe
- Mute
- Subscribe to RSS Feed
- Permalink
- Report Inappropriate Content
Hi,
this might help, but I think that Your input data(excelsheet) is not "Clear" enough. Hardcoded Field is always a big risk.
Temp:
CrossTable([WW Sales], Data, 2)
LOAD Rank,
Company,
[2014],
[2020],
[2014-20],
[20141],
[20201],
[2014-201]
FROM
(ooxml, embedded labels, header is 1 lines, table is Sheet1);
NoConcatenate
Data:
LOAD Rank,
Company,
[WW Sales],
If([WW Sales] ='2014' or [WW Sales]='2020','WW Sales ($m)',
If([WW Sales] ='20141' or [WW Sales]='20201','WW Market Share',
If([WW Sales] ='2014-20','CAGR',if([WW Sales] ='2014-201','Rank Chg.')))) as Header,
Data
Resident Temp;
Drop table Temp;