Unlock a world of possibilities! Login now and discover the exclusive benefits awaiting you.
- Qlik Community
- :
- All Forums
- :
- QlikView App Dev
- :
- Re: Transforming integer to percentage in pie char...
- Subscribe to RSS Feed
- Mark Topic as New
- Mark Topic as Read
- Float this Topic for Current User
- Bookmark
- Subscribe
- Mute
- Printer Friendly Page
- Mark as New
- Bookmark
- Subscribe
- Mute
- Subscribe to RSS Feed
- Permalink
- Report Inappropriate Content
Transforming integer to percentage in pie chart
Hello everyone,
I am trying to convert number to percentage in a pie chart, which i have 3 expressions:
sum([Baby Boomers])
sum(X)
sum(Y)
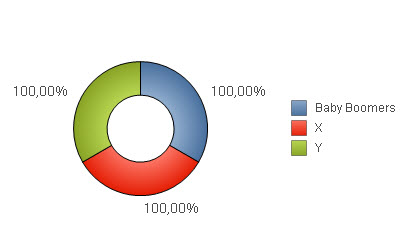
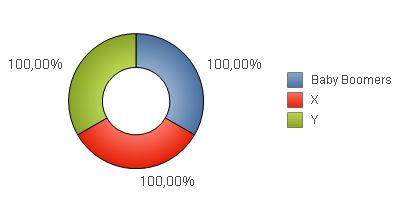
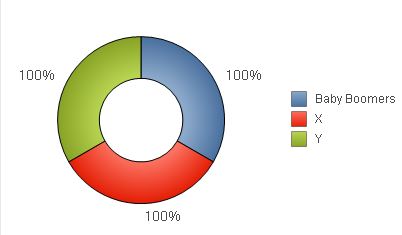
In the Expression tab, when i select the relative box, all results are 100%:
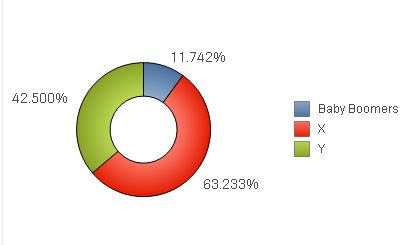
If i unselect the relative box and set the percentage in the Number tab, the results are wrong:
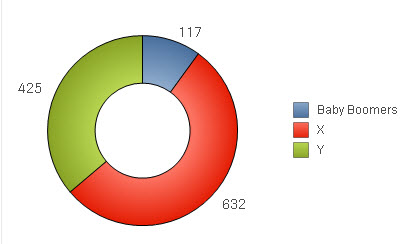
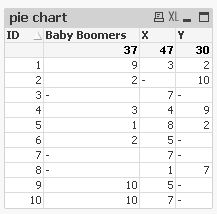
Below is the chart with the original numbers:
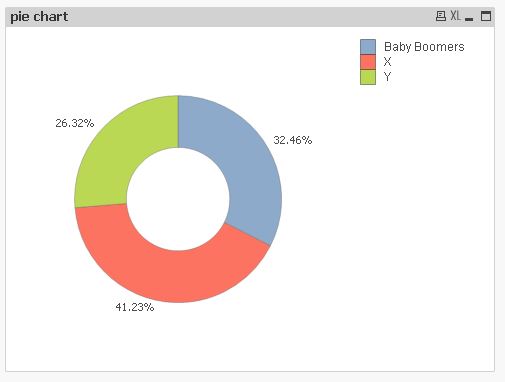
How can i convert the numbers above to the correct percentage?
Regards
- Tags:
- new_to_qlikview
- « Previous Replies
-
- 1
- 2
- Next Replies »
Accepted Solutions
- Mark as New
- Bookmark
- Subscribe
- Mute
- Subscribe to RSS Feed
- Permalink
- Report Inappropriate Content
Hi,
one solution could be either:
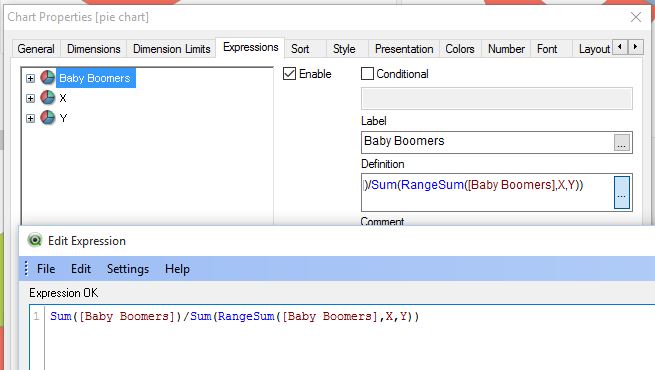
(Rangesum() instead of just adding the fields for proper null-value results)
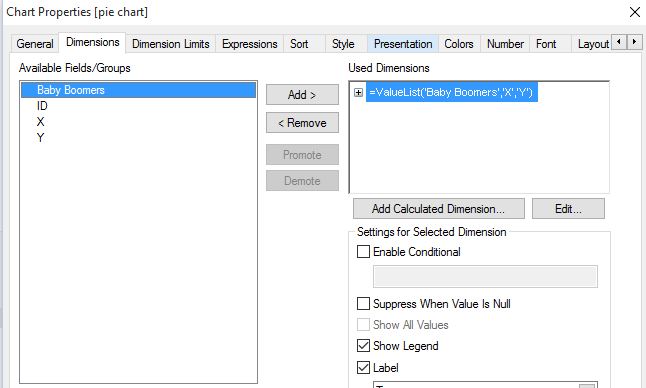
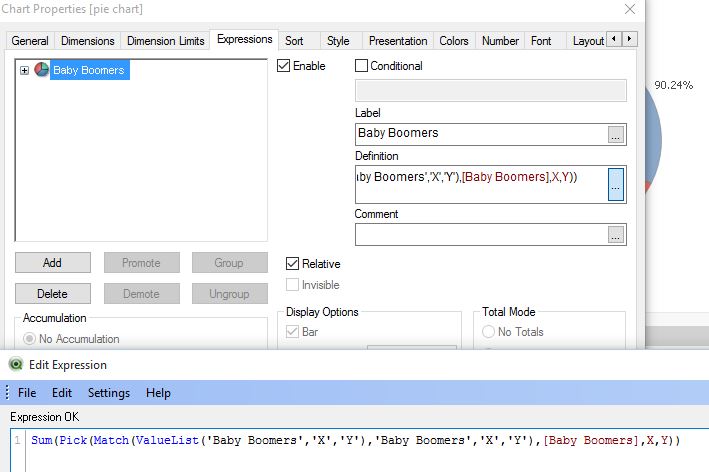
or (without changing your data model) using a calculated dimension and a single expression to be able to use the "relative" option for expressions like already suggested by swuehl (although I think his CrossTable solution results in the better data model for your requirements):
hope this helps
regards
Marco
- Mark as New
- Bookmark
- Subscribe
- Mute
- Subscribe to RSS Feed
- Permalink
- Report Inappropriate Content
Hi
I would look at something like
sum([Baby Boomers]) / (sum([Baby Boomers]) + sum(X) + sum(Y))
sum(X) / (sum([Baby Boomers]) + sum(X) + sum(Y))
sum(Y) / (sum([Baby Boomers]) + sum(X) + sum(Y))
Mark
- Mark as New
- Bookmark
- Subscribe
- Mute
- Subscribe to RSS Feed
- Permalink
- Report Inappropriate Content
can u share sample .qvw?
- Mark as New
- Bookmark
- Subscribe
- Mute
- Subscribe to RSS Feed
- Permalink
- Report Inappropriate Content
Thanks for your response Mark.
I have other pie chart, with different expressions:
sum({<[Generations]={"Regional"}>}[Baby Boomers])
sum({<[Generations]={"Regional"}>}X)
sum({<[Generations]={"Regional"}>}Y)
I am just selecting values from Regional for each Generation.
How it should be the expression to calculate the percentage in that case?
Best regards,
- Mark as New
- Bookmark
- Subscribe
- Mute
- Subscribe to RSS Feed
- Permalink
- Report Inappropriate Content
Rodrigo
You can calculate it or simply mark the option "Relative" in expressions tab.
![2015-11-26 14_14_35-QlikView x64 - [QV1].png](/legacyfs/online/107397_2015-11-26 14_14_35-QlikView x64 - [QV1].png)
- Mark as New
- Bookmark
- Subscribe
- Mute
- Subscribe to RSS Feed
- Permalink
- Report Inappropriate Content
Hi Márcio,
When i select the option Relative in expressions tab, the result is wrong, all values is 100% as i mentioned before:
- Mark as New
- Bookmark
- Subscribe
- Mute
- Subscribe to RSS Feed
- Permalink
- Report Inappropriate Content
Hi Rodrigo,
May be try this expression..
sum({<[Generations]={"Regional"}>}[Baby Boomers])/sum({<[Generations]={"Regional"}>} TOTAL [Baby Boomers])
sum({<[Generations]={"Regional"}>}X)/sum({<[Generations]={"Regional"}>} TOTAL X)
sum({<[Generations]={"Regional"}>}Y)/sum({<[Generations]={"Regional"}>} TOTAL Y)
And, set the percentage in the Number tab..
- Mark as New
- Bookmark
- Subscribe
- Mute
- Subscribe to RSS Feed
- Permalink
- Report Inappropriate Content
Hi settu_periasamy,
Unfortunately the expression you suggested didn´t work.
It displayed all values with 100%:
- Mark as New
- Bookmark
- Subscribe
- Mute
- Subscribe to RSS Feed
- Permalink
- Report Inappropriate Content
Look at the alternative solution I suggested here:
Using multiple fields in a pie chart
i.e. use a dimension with one expression instead of three expression with no dimension. Then you can simply check the 'relative' option.
- Mark as New
- Bookmark
- Subscribe
- Mute
- Subscribe to RSS Feed
- Permalink
- Report Inappropriate Content
Hi Rodrigo,
Just to confirm,
Did you uncheck relative and set "Fixed to" and "Show in percentage" in Number Tab.
Or,
=Num(YourExpression,'#.##0%') -> Expression Default in Number Tab
- « Previous Replies
-
- 1
- 2
- Next Replies »