Unlock a world of possibilities! Login now and discover the exclusive benefits awaiting you.
- Qlik Community
- :
- All Forums
- :
- QlikView App Dev
- :
- Trend Line in Scatter Chart
- Subscribe to RSS Feed
- Mark Topic as New
- Mark Topic as Read
- Float this Topic for Current User
- Bookmark
- Subscribe
- Mute
- Printer Friendly Page
- Mark as New
- Bookmark
- Subscribe
- Mute
- Subscribe to RSS Feed
- Permalink
- Report Inappropriate Content
Trend Line in Scatter Chart
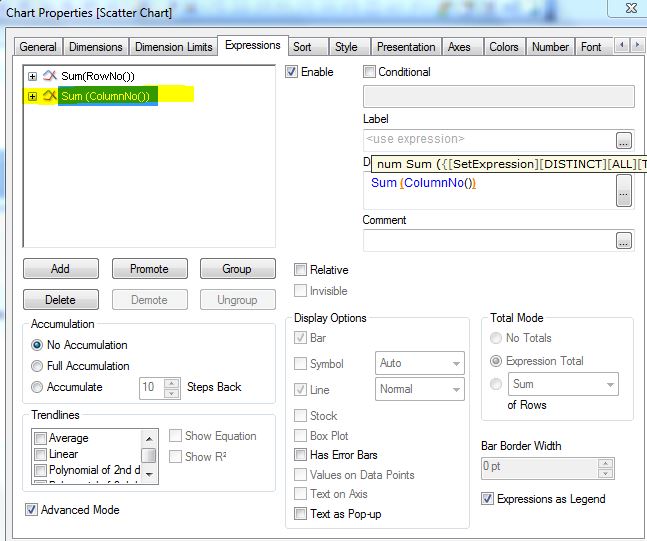
I'm attempting to add a trend line to the scatter chart below, but the option seems to be greyed out. My information is as follows:
Dimension-Student Name/ID
Expression 1- Student Test Score
Expression 2- Current Grade in Course
Should I change the chart type? If so, should I also change one of these expressions to be a dimension?
Also, less urgent question, I want to ultimately change the color of the dot representing a student if they are a certain amount away from the trend line. For instance if a student has a grade of say 85, but a test score of 15 (or vice versa), we want that student in bold red. Is there a way to do this as well?
- Mark as New
- Bookmark
- Subscribe
- Mute
- Subscribe to RSS Feed
- Permalink
- Report Inappropriate Content
Hi,
Can you check Second Expression shows the Trendline data?
- Mark as New
- Bookmark
- Subscribe
- Mute
- Subscribe to RSS Feed
- Permalink
- Report Inappropriate Content
Wow, I feel foolish. That absolutely fixed the problem. Thanks!