Unlock a world of possibilities! Login now and discover the exclusive benefits awaiting you.
- Qlik Community
- :
- All Forums
- :
- QlikView App Dev
- :
- Trend diagram and canonical dates...
- Subscribe to RSS Feed
- Mark Topic as New
- Mark Topic as Read
- Float this Topic for Current User
- Bookmark
- Subscribe
- Mute
- Printer Friendly Page
- Mark as New
- Bookmark
- Subscribe
- Mute
- Subscribe to RSS Feed
- Permalink
- Report Inappropriate Content
Trend diagram and canonical dates...
Hi All!
I have data from a very simple "ticket"-system where users may send requests or errors. These requests/errors creates tickets and may only have two status: Open & Closed. There is an Open_Date and a Closed_Date for each ticket.
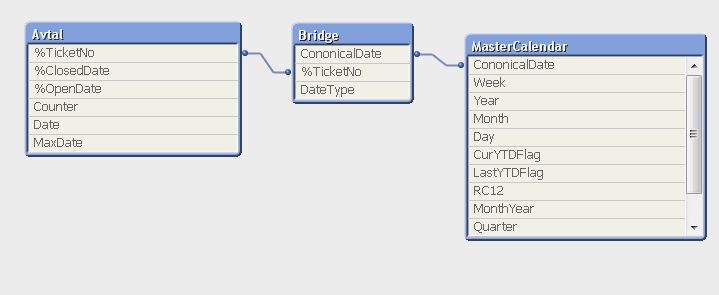
I have created a simple trend diagram that shows a (Daily) date dimension on the x-axis and amount of tickets on the y-axis. I show, for any given date, the amount of Received tickets (using the Open_Date) and Closed tickets using the Close_Date. To do this I have made a canonical date dimension (see this article by Henric Cronström). Now this only shows me the amount of tickets received or closed that given date, but lets say that there are tickets open that where created before the given date. How do I make an expression for these tickets?
So for each date I want to show:
1 - Received Tickets
2 - Closed Tickets
3 - Open Tickets (Received tickets with status "open" + older tickets with status "open")
Br
Christian
- Mark as New
- Bookmark
- Subscribe
- Mute
- Subscribe to RSS Feed
- Permalink
- Report Inappropriate Content
If the ticket has status "Open" there is no ClosedDate.
- Mark as New
- Bookmark
- Subscribe
- Mute
- Subscribe to RSS Feed
- Permalink
- Report Inappropriate Content
Nobody have a suggestion?
- Mark as New
- Bookmark
- Subscribe
- Mute
- Subscribe to RSS Feed
- Permalink
- Report Inappropriate Content
I am also trying to make a bar graph that reports very similarly like what you have described above. Have you (or anyone else) been able to figure out a solution for his problem??
- Mark as New
- Bookmark
- Subscribe
- Mute
- Subscribe to RSS Feed
- Permalink
- Report Inappropriate Content
You can have a look at another one of Henric's blog posts:
Creating Reference Dates for Intervals
Following that, maybe something like
Avtal:
Load %TicketNo, %ClosedDate, %OpenDate, Counter, Date, MaxDate
From Avtal;
Tickets_x_Dates:
Load %TicketNo,
If(iterNo()=1, 1) as OpenFlag,
If( %OpenDate +Iterno()-1 = %ClosedDate,1) as ClosedFlag,
Date( %OpenDate+ IterNo() – 1 ) as ReferenceDate
Resident Avtal
While IterNo() <= Alt(%ClosedDate,Today() ) - %OpenDate+ 1 ;
Then create a chart with dimension ReferenceDate (or a calendar dimension of a calendar table linked to this field) and three expressions:
=Count(DISTINCT %TicketNo) //Total Open
=Count({<OpenFlag = {1} >} DISTINCT %TicketNo) // Created
=Count({<ClosedFlag = {1} >} DISTINCT %TicketNo) // Closed
- Mark as New
- Bookmark
- Subscribe
- Mute
- Subscribe to RSS Feed
- Permalink
- Report Inappropriate Content
I was actually able to use a simple if statement within the dimension, that checked my Canonical date compared to my date fields
=If(CanonicalDate = [First Application Submitted Date],'Application Submitted','Application Completed')
This works for simple Canonical with just a couple of fields, I will need to create this effect with multiple canonical date fields so that might get more complicated... So I might try what you have suggested.
- Mark as New
- Bookmark
- Subscribe
- Mute
- Subscribe to RSS Feed
- Permalink
- Report Inappropriate Content
Hi,
an alternative solution would be to use Intervalmatch() to generate a linktable between your opened/closed intervals and your calendar.
hope this helps
regards
Marco