Unlock a world of possibilities! Login now and discover the exclusive benefits awaiting you.
- Qlik Community
- :
- All Forums
- :
- QlikView App Dev
- :
- Trendline using linest_ function within a range
- Subscribe to RSS Feed
- Mark Topic as New
- Mark Topic as Read
- Float this Topic for Current User
- Bookmark
- Subscribe
- Mute
- Printer Friendly Page
- Mark as New
- Bookmark
- Subscribe
- Mute
- Subscribe to RSS Feed
- Permalink
- Report Inappropriate Content
Trendline using linest_ function within a range
Hi Experts,
I have the following data:
| MonthYear | SalesQty |
| Jan-13 | 10000 |
| Feb-13 | 11000 |
| Mar-13 | 15000 |
| Apr-13 | 8500 |
| May-13 | 0 |
| Jun-13 | 0 |
| Jul-13 | 0 |
| Aug-13 | 0 |
| Sep-13 | 0 |
| Oct-13 | 0 |
| Nov-13 | 0 |
| Dec-13 | 0 |
I am using the following expression to get trendline:
LINEST_M(TOTAL aggr(sum(SalesQty),MonthYear),MonthYear)*MonthYear + linest_b(total aggr(sum(SalesQty),MonthYear),MonthYear)
This takes even the zero values of salesqty and plot the trend (which give not the very best trend).
Is is possible to specify in linest_m and linest_b function to take only the range from Jan-2013 to April-2013 into account for plotting the trendline?
OR
If there is any other way, please answer.
Accepted Solutions
- Mark as New
- Bookmark
- Subscribe
- Mute
- Subscribe to RSS Feed
- Permalink
- Report Inappropriate Content
I found something helpful on the post:
http://community.qlik.com/thread/53721
and this solves my problem.
Thanks to dtalbot777
- Mark as New
- Bookmark
- Subscribe
- Mute
- Subscribe to RSS Feed
- Permalink
- Report Inappropriate Content
Hi Everyone,
I could not find any solution on any other discussion.
Could anyone please help me on this?
I basically want linest_m function to use only a limited time period to project the trendline.
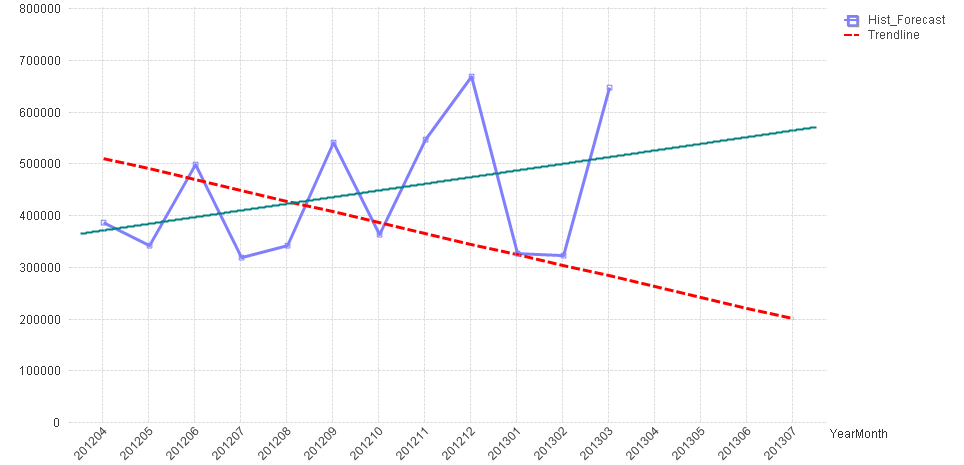
The red-dotted line gives the forecast using linest_m and linest_b function
Expression as:
=LINEST_M(TOTAL aggr(sum(OrderQty),YearMonth),YearMonth)* YearMonth
+ linest_b(total aggr(sum(OrderQty),YearMonth),YearMonth)
Is there any way I can ask the linest_m and linest_b function to use the values from 201204 to 201303 to use as history and project the trendline?
- Mark as New
- Bookmark
- Subscribe
- Mute
- Subscribe to RSS Feed
- Permalink
- Report Inappropriate Content
I found something helpful on the post:
http://community.qlik.com/thread/53721
and this solves my problem.
Thanks to dtalbot777