Unlock a world of possibilities! Login now and discover the exclusive benefits awaiting you.
- Qlik Community
- :
- All Forums
- :
- QlikView App Dev
- :
- Re: Trial Balance - exclude negative accounts
- Subscribe to RSS Feed
- Mark Topic as New
- Mark Topic as Read
- Float this Topic for Current User
- Bookmark
- Subscribe
- Mute
- Printer Friendly Page
- Mark as New
- Bookmark
- Subscribe
- Mute
- Subscribe to RSS Feed
- Permalink
- Report Inappropriate Content
Trial Balance - exclude negative accounts
Hi,
In balance sheets bank accounts change their group from assets to liabilities in case of negative balances. In my example I am trying to exclude the accounts with negative balances and to show the right sums per group, which would be in this case for the 'bank' group of accounts 21.100.
Anyone has an idea how to solve this so that it works through all dimensions in a pivottable and the correct sums are shown.
Maybe my thinking was to complex.
Many thanks
Peter
- « Previous Replies
-
- 1
- 2
- Next Replies »
- Mark as New
- Bookmark
- Subscribe
- Mute
- Subscribe to RSS Feed
- Permalink
- Report Inappropriate Content
Hi, it works, many thanks. Would you have any idea how it could work if you add a month dimension and have a sum over the month?
- Mark as New
- Bookmark
- Subscribe
- Mute
- Subscribe to RSS Feed
- Permalink
- Report Inappropriate Content
Peter,
You might get inaccurate data once you bring in the month. In the original example, Account 1015 would be excluded because the total account amount was negative. If you add the Month as a dimension, there are months where the amount is positive, even though the total account is negative. See the screen shot below for account 1015: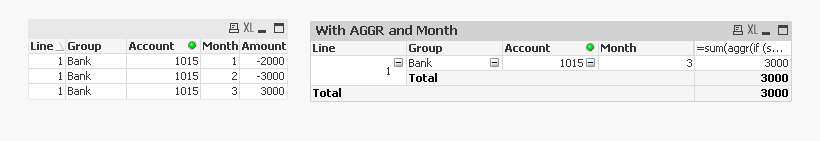
Here are the two charts, the original with just the Line, Group and Account and the new one with the additional Month dimension, for comparison:
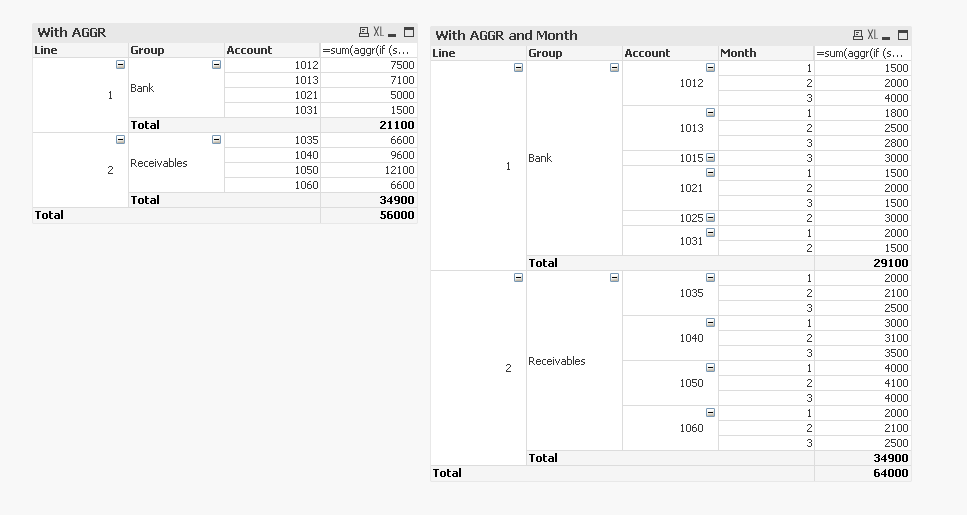
You can clearly see how a couple of accounts made the list on the second chart that really shouldn't have as per your specs listed above.
Hope this helps!
- Mark as New
- Bookmark
- Subscribe
- Mute
- Subscribe to RSS Feed
- Permalink
- Report Inappropriate Content
Hi, many thanks. I know that the month-dimension is not possible but thought that you would have an idea to separate month results from total results (all 3 month).
Anyway this was great help because I went into the wrong direction.
Best regards
- « Previous Replies
-
- 1
- 2
- Next Replies »