Unlock a world of possibilities! Login now and discover the exclusive benefits awaiting you.
- Qlik Community
- :
- All Forums
- :
- QlikView App Dev
- :
- Re: Tricky aggregation question
- Subscribe to RSS Feed
- Mark Topic as New
- Mark Topic as Read
- Float this Topic for Current User
- Bookmark
- Subscribe
- Mute
- Printer Friendly Page
- Mark as New
- Bookmark
- Subscribe
- Mute
- Subscribe to RSS Feed
- Permalink
- Report Inappropriate Content
Tricky aggregation question
Hello QV Community -
I'm stuck on this question: I have a table with four columns: Date, Time, Market and Station. I want to display a text box showing the count of rows where there is just 1 station when grouped by Date&Time&Market.
For example, if my Date, Time, Market, Station data is this ...
| Date | Time | Market | Station |
|---|---|---|---|
| 2015-03-01 | 1000 | Dallas | WFAA |
| 2015-03-02 | 1000 | Dallas | WUSA |
| 2015-03-03 | 1100 | Dallas | WFAA |
| 2015-03-03 | 1100 | Chicago | WBBM |
| 2015-03-03 | 1100 | Chicago | WMAQ |
| 2015-03-03 | 1100 | Chicago | WLS |
| 2015-03-03 | 0900 | Portland | KYW |
... the expected count would be 2 (the bold rows).
Thank you.
Accepted Solutions
- Mark as New
- Bookmark
- Subscribe
- Mute
- Subscribe to RSS Feed
- Permalink
- Report Inappropriate Content
Try Like Below:
Sum(IF(Aggr(Count(Distinct Station),Date,Time,Market) = 1 , 1, 0))
- Mark as New
- Bookmark
- Subscribe
- Mute
- Subscribe to RSS Feed
- Permalink
- Report Inappropriate Content
Try Like Below:
Sum(IF(Aggr(Count(Distinct Station),Date,Time,Market) = 1 , 1, 0))
- Mark as New
- Bookmark
- Subscribe
- Mute
- Subscribe to RSS Feed
- Permalink
- Report Inappropriate Content
Not sure I understand your analysis, what about rows 1 and 2?
- Mark as New
- Bookmark
- Subscribe
- Mute
- Subscribe to RSS Feed
- Permalink
- Report Inappropriate Content
As per your description, you should get 4 Rows and those are 1,2,3,7
- Mark as New
- Bookmark
- Subscribe
- Mute
- Subscribe to RSS Feed
- Permalink
- Report Inappropriate Content
-Sum(Aggr(Count(Distinct Station)=1,Date,Time,Market))
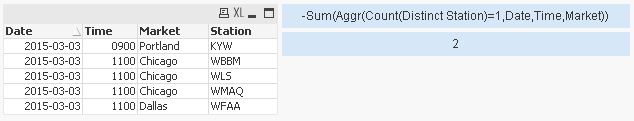
hope this helps
regards
Marco