Unlock a world of possibilities! Login now and discover the exclusive benefits awaiting you.
- Qlik Community
- :
- All Forums
- :
- QlikView App Dev
- :
- Re: Trouble with Pivot table for a financial repor...
- Subscribe to RSS Feed
- Mark Topic as New
- Mark Topic as Read
- Float this Topic for Current User
- Bookmark
- Subscribe
- Mute
- Printer Friendly Page
- Mark as New
- Bookmark
- Subscribe
- Mute
- Subscribe to RSS Feed
- Permalink
- Report Inappropriate Content
Trouble with Pivot table for a financial report
Hi Everyone,
I have the data in the following format
Level 1 | Level 2 | Level 3 | Level 4 |
Total Revenues | Car Revenues | Car A sales | $10 |
Total Revenues | Car Revenues | Car B sales | $20 |
Total Revenues | Truck Revenues | Truck M sales | $30 |
Total Revenues | Truck Revenues | Truck N sales | $40 |
Total Revenues | Bus Revenues | Bus X sales | $50 |
Total Revenues | Bus Revenues | Bus Y sales | $60 |
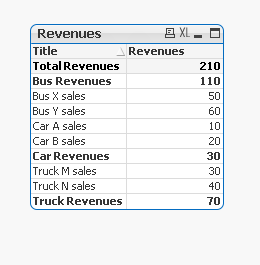
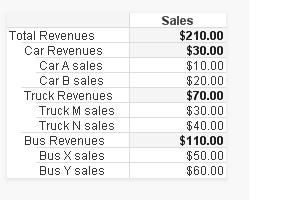
I want to generate the report as shown below
Total Revenues | $210 |
Car Revenues | $30 |
Car A sales | $10 |
Car B sales | $20 |
Truck Revenues | $70 |
Truck M sales | $30 |
Truck N sales | $40 |
Bus Revenues | $110 |
Bus X sales | $50 |
Bus Y sales | $60 |
The problem is if I use a pivot table it gives me the right chart but when I expand, it expands horizontally whereas I want a vertical flow report as shown above. This is a proxy dta for actual financial statement build. Any help would be appreciated
Thanks
- Mark as New
- Bookmark
- Subscribe
- Mute
- Subscribe to RSS Feed
- Permalink
- Report Inappropriate Content
Hi,
Maybe something like this:
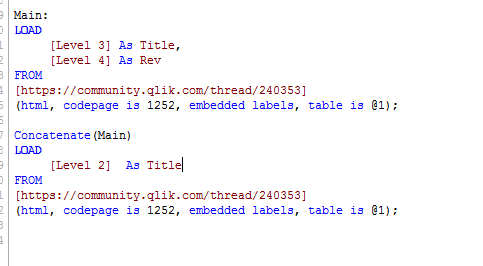
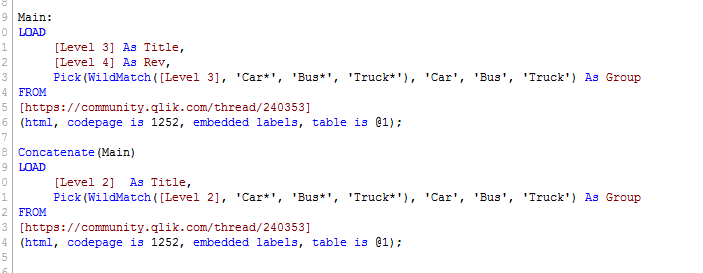
This is a hackish way of doing this. In the load script, I split the titles that would be used in the subtotals from the rest of the dataset and then concatenated them together:
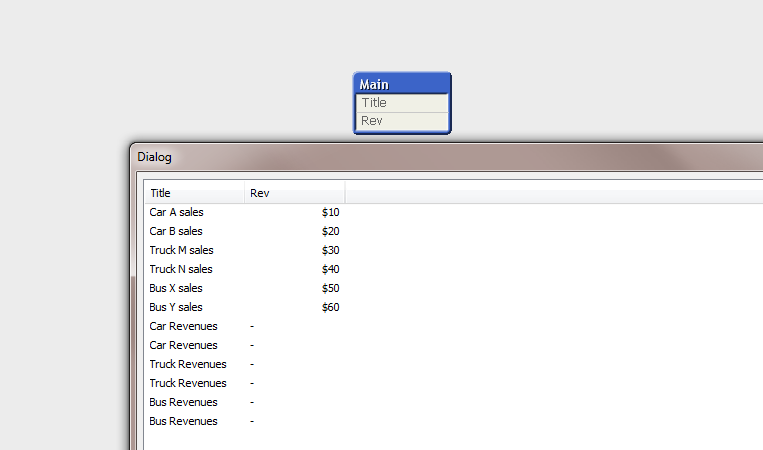
This created additional rows with blank values:
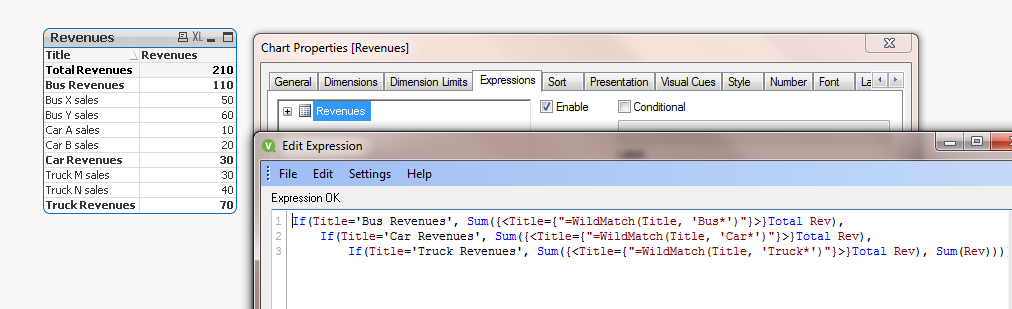
And in a straight table, I just used the below expression:
I am also attaching the actual app.
Let me know if this helps.
Thanks
- Mark as New
- Bookmark
- Subscribe
- Mute
- Subscribe to RSS Feed
- Permalink
- Report Inappropriate Content
And if you wanted to sort this, group each vehicle under a general name:
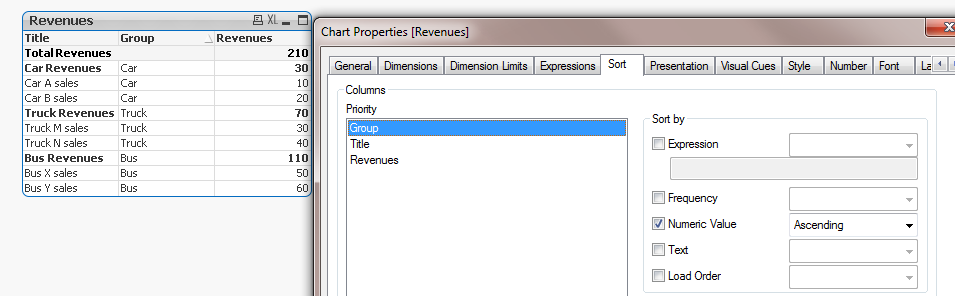
And then in the straight table, first sort on the group field:
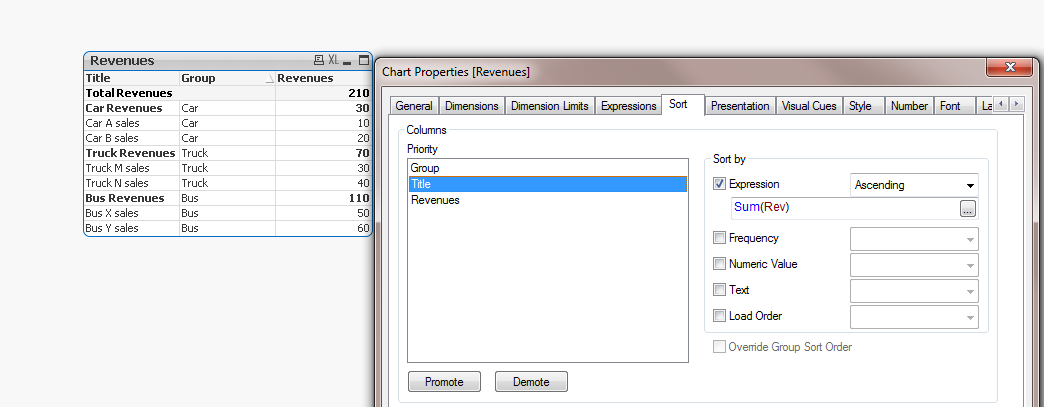
Then on the title field:
Please see the attached.
Thanks
- Mark as New
- Bookmark
- Subscribe
- Mute
- Subscribe to RSS Feed
- Permalink
- Report Inappropriate Content
Here is one simple way of doing it but the format of the table will be little different. I hope you like it....
Let me know if you like the idea or not..