Unlock a world of possibilities! Login now and discover the exclusive benefits awaiting you.
- Qlik Community
- :
- All Forums
- :
- QlikView App Dev
- :
- Re: Trying to create a chart in QV - help!
- Subscribe to RSS Feed
- Mark Topic as New
- Mark Topic as Read
- Float this Topic for Current User
- Bookmark
- Subscribe
- Mute
- Printer Friendly Page
- Mark as New
- Bookmark
- Subscribe
- Mute
- Subscribe to RSS Feed
- Permalink
- Report Inappropriate Content
Trying to create a chart in QV - help!
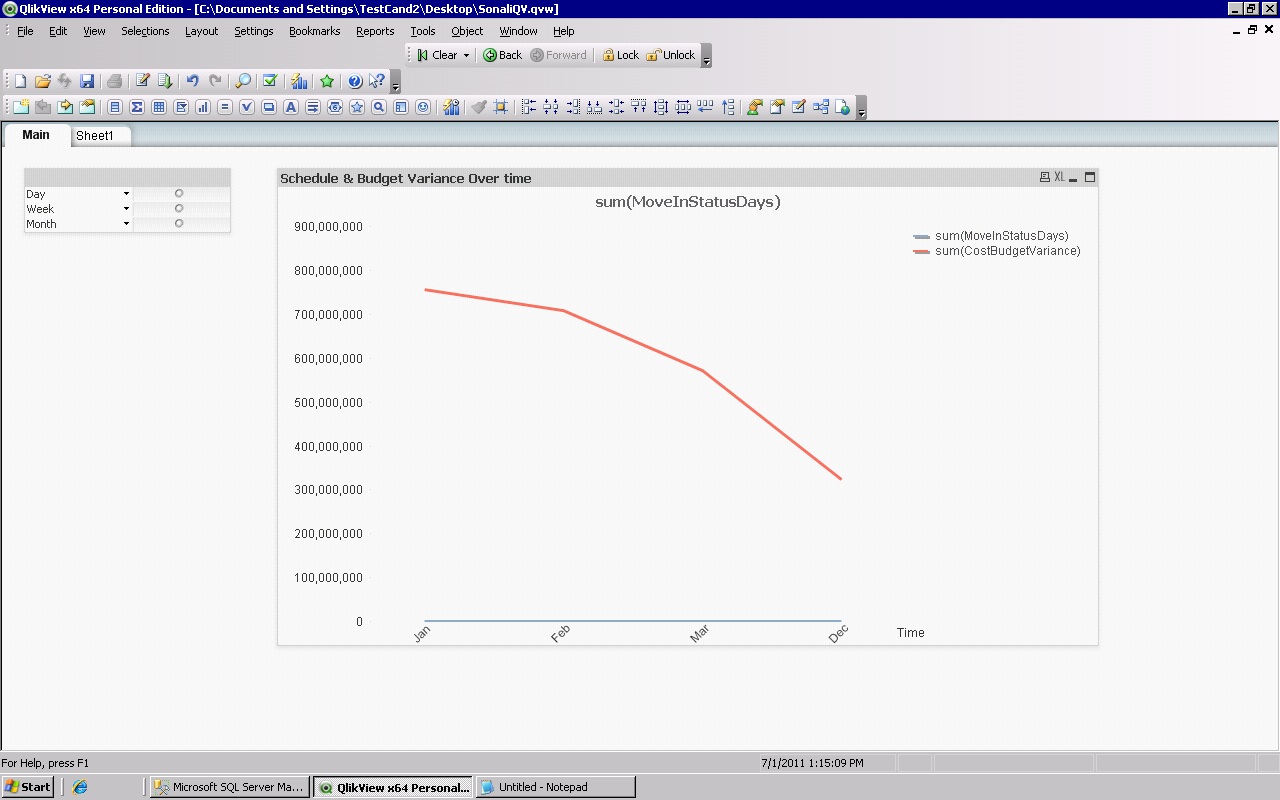
I have created tried to create chart in QV to show budget and schedule variance over time. Also, I've tried to add a control to this time to show the information by day, week and month. I also have to show the variance by time with a specific project manager - I haven't done this yet, but I'm assuming I'll have to put it on another sheet?
But with regards to the below chart - have I done the task I set out to do or show? I think I have, but it's my first day on QV and I have no idea! 
 Any help would be so much appreciated.Thank you!
Also, to show the variance for each project as of today can I do it on this or create another chart/sheet for that? I have attached the details of the task. Thanks.
- Tags:
- new_to_qlikview
- « Previous Replies
-
- 1
- 2
- Next Replies »
- Mark as New
- Bookmark
- Subscribe
- Mute
- Subscribe to RSS Feed
- Permalink
- Report Inappropriate Content
Wow! Thanks again. I'll definitely try your suggestions. Thank you so much.
Have a great weekend!
On Fri, Jul 1, 2011 at 5:54 PM, John Witherspoon <
- Mark as New
- Bookmark
- Subscribe
- Mute
- Subscribe to RSS Feed
- Permalink
- Report Inappropriate Content
John,
Sorry to bother you, but I'm really stuck on something in QV and I just want
to run a few things by you. I'm on the last few steps of the project and I
really just want to get it done
The task wants me to show the volume for change orders by project manager
and the purchase orders by vendor. Is it possible to put this on the same
chart? Also I have to show grouping by managing office and vendor.
I don't think the expressions I have - count(changeorder_num) and
count(purchaseorder_num) does this? Plus I have to group by managing office
and vendor. So far I have made project manager a dimension and the
count(changeorder_num) and count(purchaseorder_num) my expressions. To show
grouping by managing office and vendor I used the group feature - the cyclic
one...is this correct? I've attached a screen shot of what I have so far.
I would appreciate any help as I have this task to complete as part of an
interview process and I have never used QV before. Just learning as I go!
Any help would be fantastic. Thank you!!
>> QlikCommunity <http://community.qlik.com/index.jspa>
>> Re: Trying to create a chart in QV - help! created by John Witherspoon<http://community.qlik.com/people/johnw>in
>> New to QlikView - View the full discussion<http://community.qlik.com/message/129515#129515>
- Mark as New
- Bookmark
- Subscribe
- Mute
- Subscribe to RSS Feed
- Permalink
- Report Inappropriate Content
It sounds to me like you want two different charts. One for the volume for change orders by managing office and project manager, and one for the purchase orders by vendor. I'm unclear how these charts would be related, so I'm guessing they aren't. I could be completely wrong, of course, but it sounds like this:
Chart 1:
dimension 1 = managing office
dimension 2 = project manager
expression = count(distinct changeorder_num)
Chart 2:
dimension = vendor
expression = count(distinct purchaseorder_num)
Best to probably have both charts visible at once, but if that isn't practical, you could set both charts to auto minimize when the other is opened: properties -> caption -> allow minimize -> auto minimize.
I put in "distinct" in case one change order or purchase order can appear more than once. It may not be needed in practice.
- Mark as New
- Bookmark
- Subscribe
- Mute
- Subscribe to RSS Feed
- Permalink
- Report Inappropriate Content
Thanks so much John. I'll try that and let you know how it goes. Much
appreciated.
**
QlikCommunity <http://community.qlik.com/index.jspa>
Re: Trying to create a chart in QV - help! created by John Witherspoon<http://community.qlik.com/people/johnw>in
New to QlikView - View the full discussion<http://community.qlik.com/message/130298#130298>
- Mark as New
- Bookmark
- Subscribe
- Mute
- Subscribe to RSS Feed
- Permalink
- Report Inappropriate Content
Hi John,
I made the changes that you suggested and it looks a lot simpler and easier to read the data. Thanks. I'll have to see what they say about it. Anyways, I've also started making a Gantt Chart and I'm having some problems actually seeing the data. I looked this up and it seems that it doesn't work with the 64 bit QV - is this true?
- Mark as New
- Bookmark
- Subscribe
- Mute
- Subscribe to RSS Feed
- Permalink
- Report Inappropriate Content
I'm afraid I haven't done any Gantt charts, and don't know if there's a problem with them in 64-bit QlikView.
- Mark as New
- Bookmark
- Subscribe
- Mute
- Subscribe to RSS Feed
- Permalink
- Report Inappropriate Content
No problem John. Thanks for all your help thus far.
- « Previous Replies
-
- 1
- 2
- Next Replies »