Unlock a world of possibilities! Login now and discover the exclusive benefits awaiting you.
- Qlik Community
- :
- All Forums
- :
- QlikView App Dev
- :
- Re: Trying to create a listbox with values created...
- Subscribe to RSS Feed
- Mark Topic as New
- Mark Topic as Read
- Float this Topic for Current User
- Bookmark
- Subscribe
- Mute
- Printer Friendly Page
- Mark as New
- Bookmark
- Subscribe
- Mute
- Subscribe to RSS Feed
- Permalink
- Report Inappropriate Content
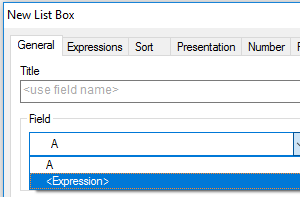
Trying to create a listbox with values created from expressions
I am trying to create a listbox to use as a filter for a pivot table that I have, the problem is that the displayed columns in that pivot table are all created by expressions, is there a way I can have the listbox show these choices?
Accepted Solutions
- Mark as New
- Bookmark
- Subscribe
- Mute
- Subscribe to RSS Feed
- Permalink
- Report Inappropriate Content
thanks for the help, I ended up just using an in line load to fix the issue.
- Mark as New
- Bookmark
- Subscribe
- Mute
- Subscribe to RSS Feed
- Permalink
- Report Inappropriate Content
if you want to filter the expression result in your pivot table, try:
aggr(YOURPIVOTABLE_EXPRESSION,YOURPIVOTABLE_DIMENSION_1, ... YOURPIVOTABLE_DIMENSION_N)
A sample would help...
- Mark as New
- Bookmark
- Subscribe
- Mute
- Subscribe to RSS Feed
- Permalink
- Report Inappropriate Content
well, right now I have a table with 3 different calculated columns, so 3 different expressions. the pivot table is using 3 dimensions, expense_type, Line_type, Line_subtype. each of the 3 expressions are almost identical. here is one of them for an example:
(sum({< SOURCE_TYPE = {'ACTUAL'},MONTH = {"$(=MONTHSTART(today()-1,-1))"},EXPENSE_TYPE-={'Base Headcount','Contractors','HR Physical Headcount'} >}AMOUNT)
/
sum({< SOURCE_TYPE = {'PLAN'},MONTH = {"$(=MONTHSTART(today()-1,-1))"},EXPENSE_TYPE-={'Base Headcount','Contractors','HR Physical Headcount'} >}AMOUNT))
-1
any help is appreciated
- Mark as New
- Bookmark
- Subscribe
- Mute
- Subscribe to RSS Feed
- Permalink
- Report Inappropriate Content
try
aggr(
(sum({< SOURCE_TYPE = {'ACTUAL'},MONTH = {"$(=MONTHSTART(today()-1,-1))"},EXPENSE_TYPE-={'Base Headcount','Contractors','HR Physical Headcount'} >}AMOUNT)
/
sum({< SOURCE_TYPE = {'PLAN'},MONTH = {"$(=MONTHSTART(today()-1,-1))"},EXPENSE_TYPE-={'Base Headcount','Contractors','HR Physical Headcount'} >}AMOUNT))
-1
,
expense_type, Line_type, Line_subtype
)
as Listbox expression:
- Mark as New
- Bookmark
- Subscribe
- Mute
- Subscribe to RSS Feed
- Permalink
- Report Inappropriate Content
thanks for the help, I ended up just using an in line load to fix the issue.