Unlock a world of possibilities! Login now and discover the exclusive benefits awaiting you.
- Qlik Community
- :
- All Forums
- :
- QlikView App Dev
- :
- Trying to get an expression that uses a variable t...
- Subscribe to RSS Feed
- Mark Topic as New
- Mark Topic as Read
- Float this Topic for Current User
- Bookmark
- Subscribe
- Mute
- Printer Friendly Page
- Mark as New
- Bookmark
- Subscribe
- Mute
- Subscribe to RSS Feed
- Permalink
- Report Inappropriate Content
Trying to get an expression that uses a variable to total at the bottom
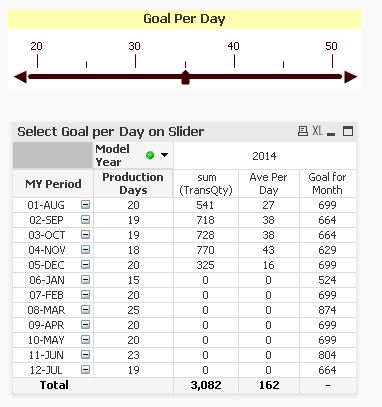
I set up a slider with a variable called vUnitsPerDay
the user slides the dashboard slider to the number of units they would like to produce per day
then I added a formula that is $(vUnitsPerDay) * [Production Days]
this multiplies the number of units we want to produce per day times the number of actual working days per month.
this works.
but when I try to sum it to get a total Goal Units for the year at the bottom of the table
the formula has everything multiplied by 4 times what it should be
20 days in month times 20units a day should equal 400
but the month goal comes to 1,600
if I don't sum it - it works perfectly
but then I can't get a total at the bottom of the chart for the year total of all months
any idea what I can do to make this work
- Mark as New
- Bookmark
- Subscribe
- Mute
- Subscribe to RSS Feed
- Permalink
- Report Inappropriate Content
could you post a sample app..
- Mark as New
- Bookmark
- Subscribe
- Mute
- Subscribe to RSS Feed
- Permalink
- Report Inappropriate Content
Hi Sue Penick
Are you using a straight table? If it is, are you experiencing this issue when checked the "expression totals" in expressions tab of chart properties?
- Mark as New
- Bookmark
- Subscribe
- Mute
- Subscribe to RSS Feed
- Permalink
- Report Inappropriate Content

- Mark as New
- Bookmark
- Subscribe
- Mute
- Subscribe to RSS Feed
- Permalink
- Report Inappropriate Content
no - pivot so it can have multiple year selection
- Mark as New
- Bookmark
- Subscribe
- Mute
- Subscribe to RSS Feed
- Permalink
- Report Inappropriate Content
Sounds like an issue in your dimensions. How many years are in your data set?
Oh and by the way look at using the DUAL function on your periods and you can get just the month names in the right order without having the number visible.
- Mark as New
- Bookmark
- Subscribe
- Mute
- Subscribe to RSS Feed
- Permalink
- Report Inappropriate Content
as many years as history is pulled in for
could be up to 7 years of history