Unlock a world of possibilities! Login now and discover the exclusive benefits awaiting you.
- Qlik Community
- :
- All Forums
- :
- QlikView App Dev
- :
- Two Dimensions with a single expression
- Subscribe to RSS Feed
- Mark Topic as New
- Mark Topic as Read
- Float this Topic for Current User
- Bookmark
- Subscribe
- Mute
- Printer Friendly Page
- Mark as New
- Bookmark
- Subscribe
- Mute
- Subscribe to RSS Feed
- Permalink
- Report Inappropriate Content
Two Dimensions with a single expression
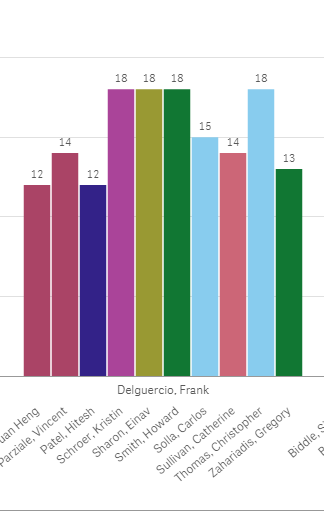
hi can any one help me achieving the below dashboard
where i had too get the data by manager and employee group by in bar chart level
on x- axis !

- « Previous Replies
- Next Replies »
- Mark as New
- Bookmark
- Subscribe
- Mute
- Subscribe to RSS Feed
- Permalink
- Report Inappropriate Content
Hi,
how to build a chart like this one
any help is appreciated,
- Mark as New
- Bookmark
- Subscribe
- Mute
- Subscribe to RSS Feed
- Permalink
- Report Inappropriate Content
Hi see below app,
It may help you
Thanks
BKC
- Mark as New
- Bookmark
- Subscribe
- Mute
- Subscribe to RSS Feed
- Permalink
- Report Inappropriate Content
you can use a combo chart or create a dimension that combines both fields manager&chr(13)&employee
- Mark as New
- Bookmark
- Subscribe
- Mute
- Subscribe to RSS Feed
- Permalink
- Report Inappropriate Content
we need some calculation where you are having date
here i do wanna see sum(issues) according by manager and employee in group by as pic i posted
i am not with aggr
aggr should have one expression, if so what will be my exp when i use manager and emp
- Mark as New
- Bookmark
- Subscribe
- Mute
- Subscribe to RSS Feed
- Permalink
- Report Inappropriate Content
Hi Venkat,
You can use Trillis chart to get this done. Visually it looks different but this is nice option,
- Mark as New
- Bookmark
- Subscribe
- Mute
- Subscribe to RSS Feed
- Permalink
- Report Inappropriate Content
Hello! you should be able to achieve your desired result by adding a second expression to your bar chart . Second expression should just be 0. Now go to presentation tab and disable legend.
- Mark as New
- Bookmark
- Subscribe
- Mute
- Subscribe to RSS Feed
- Permalink
- Report Inappropriate Content
I didnt get your point
how can my second expression can be 0
if any exp pls pass it
- Mark as New
- Bookmark
- Subscribe
- Mute
- Subscribe to RSS Feed
- Permalink
- Report Inappropriate Content
Please SEE ATTACHED PICTURE. In this case the two dimensions are Transaction Year and Transaction Month. The two expressions are sum(nsv) and 0. In your chart you need to add a second expression and just type 0 in expression definition. (see screen shot) . Next disable legend in properties>presentation (screenshot attached).
- Mark as New
- Bookmark
- Subscribe
- Mute
- Subscribe to RSS Feed
- Permalink
- Report Inappropriate Content
ya but for me its different scenari
i have done same here but i cant get it
its showing blank
do i have to use any limitations or any
i should get the employees names by group by pdm
- « Previous Replies
- Next Replies »