Unlock a world of possibilities! Login now and discover the exclusive benefits awaiting you.
- Qlik Community
- :
- All Forums
- :
- QlikView App Dev
- :
- Re: Two Dimensions with a single expression
- Subscribe to RSS Feed
- Mark Topic as New
- Mark Topic as Read
- Float this Topic for Current User
- Bookmark
- Subscribe
- Mute
- Printer Friendly Page
- Mark as New
- Bookmark
- Subscribe
- Mute
- Subscribe to RSS Feed
- Permalink
- Report Inappropriate Content
Two Dimensions with a single expression
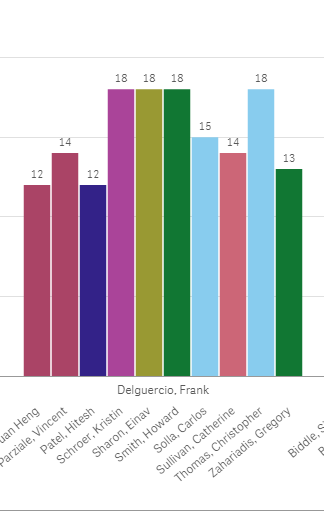
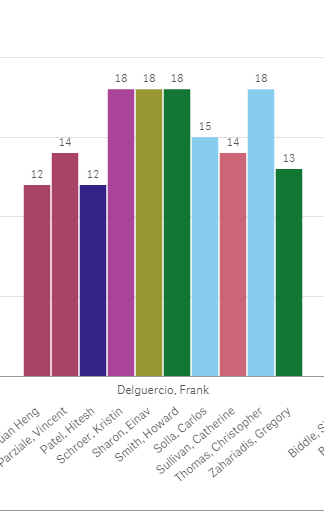
hi can any one help me achieving the below dashboard
where i had too get the data by manager and employee group by in bar chart level
on x- axis !

- Mark as New
- Bookmark
- Subscribe
- Mute
- Subscribe to RSS Feed
- Permalink
- Report Inappropriate Content
please can u share sample. what are your dimensions and expression?
- Mark as New
- Bookmark
- Subscribe
- Mute
- Subscribe to RSS Feed
- Permalink
- Report Inappropriate Content
Here i am Having
managers in their team around 5 to 10 employees as below image
where delguercio is manager
others are emp

- Mark as New
- Bookmark
- Subscribe
- Mute
- Subscribe to RSS Feed
- Permalink
- Report Inappropriate Content
Yes so your two dimensions will be manager and employee. Could you pls post a sample qvw with expression and dimension then I could try making the chart like the pic I posted
- Mark as New
- Bookmark
- Subscribe
- Mute
- Subscribe to RSS Feed
- Permalink
- Report Inappropriate Content
please find the attached file
- Mark as New
- Bookmark
- Subscribe
- Mute
- Subscribe to RSS Feed
- Permalink
- Report Inappropriate Content
which is employee name field and which is the manager name field?
- Mark as New
- Bookmark
- Subscribe
- Mute
- Subscribe to RSS Feed
- Permalink
- Report Inappropriate Content
PDM last name is the Manager
employee is employee or you can use last name or name
- Mark as New
- Bookmark
- Subscribe
- Mute
- Subscribe to RSS Feed
- Permalink
- Report Inappropriate Content
Does this match your requirement?
- Mark as New
- Bookmark
- Subscribe
- Mute
- Subscribe to RSS Feed
- Permalink
- Report Inappropriate Content
Ya Thats fine
- Mark as New
- Bookmark
- Subscribe
- Mute
- Subscribe to RSS Feed
- Permalink
- Report Inappropriate Content
Create bar chart with PDM Last Name & Employee as Dimensions
If you want chart to display manager name at first and then employee name only once manager name is selected then add condition getselectedcount(PDM Last Name)>0 in Employee dimemsion condition. Else ignore this step.
Add expressions MTTR - Sum([Issue Age] * [L1 MTTR Closures])/Sum([L1 MTTR Closures])/1440.0
Add second expression - 0
Disable legend from presentation tab
- Mark as New
- Bookmark
- Subscribe
- Mute
- Subscribe to RSS Feed
- Permalink
- Report Inappropriate Content
could you please share the App so that i can look how you had created it
i am trying but i am not getting which as you had shared a pic