Unlock a world of possibilities! Login now and discover the exclusive benefits awaiting you.
- Qlik Community
- :
- All Forums
- :
- QlikView App Dev
- :
- Re: Two Trend Line for Two different Date Fields w...
- Subscribe to RSS Feed
- Mark Topic as New
- Mark Topic as Read
- Float this Topic for Current User
- Bookmark
- Subscribe
- Mute
- Printer Friendly Page
- Mark as New
- Bookmark
- Subscribe
- Mute
- Subscribe to RSS Feed
- Permalink
- Report Inappropriate Content
Two Trend Line for Two different Date Fields with Two Month-Year Dimensions
Hi Community,
Here I'm facing Problem in line chart.
I have two Date Fileds
1) Issue Reported Date
2) Issue Closure Date
Also having two Month-Year Fields (like Jan-16, Nov-15) which are getting out of above date Fields.
Dimension
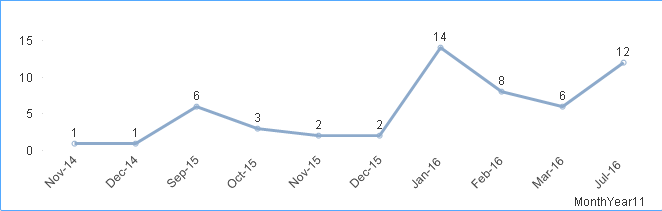
1) Month-Year11( Issue Reported Date)
2) Month-Year22( Issue Closure Date)
Expression
Count(Issue ID)

So I want to collaborate above charts. How Can I get this ?
- Mark as New
- Bookmark
- Subscribe
- Mute
- Subscribe to RSS Feed
- Permalink
- Report Inappropriate Content
What expression you have tried for two charts and dimensions
You want to merge as one chart or you want to add trend lines
- Mark as New
- Bookmark
- Subscribe
- Mute
- Subscribe to RSS Feed
- Permalink
- Report Inappropriate Content
If you want both lines in one chart then you need to create a single time dimension in the script and add a date type field where you store the values 'Reported' and 'Closure' to be able to distinguish between the types of dates. What exactly you need to change in the script depends on your source data, which you didn't say anything about.
talk is cheap, supply exceeds demand
- Mark as New
- Bookmark
- Subscribe
- Mute
- Subscribe to RSS Feed
- Permalink
- Report Inappropriate Content
Please read again I above update write up..
Here I used Count(Issue id) as an Expression
And Dimension
Month-Year11 as a Dimension for One chart
Month-Year22 as a Dimension for Second Chart
- Mark as New
- Bookmark
- Subscribe
- Mute
- Subscribe to RSS Feed
- Permalink
- Report Inappropriate Content
Hi ,
Sorry I can't understand your requirement could you be more clear on what you exactly need, do you need only one chart?
Regards,
Balakrishnan.R
- Mark as New
- Bookmark
- Subscribe
- Mute
- Subscribe to RSS Feed
- Permalink
- Report Inappropriate Content
Combine ur data with maintaining Flag and use two exp
to see two lines in your chart
-Nagarjun
- Mark as New
- Bookmark
- Subscribe
- Mute
- Subscribe to RSS Feed
- Permalink
- Report Inappropriate Content
Can You Elaborate this ?
- Mark as New
- Bookmark
- Subscribe
- Mute
- Subscribe to RSS Feed
- Permalink
- Report Inappropriate Content
Date(monthstart([Issue Reported Date]), 'MMM-YY') as MonthYear11
I had used this Expression to get Month-Year. but it will not give correctly Month-Year of Issue Closure date.
What needs to be implement here?