Unlock a world of possibilities! Login now and discover the exclusive benefits awaiting you.
- Qlik Community
- :
- All Forums
- :
- QlikView App Dev
- :
- Two line charts with set analysis are behaving dif...
- Subscribe to RSS Feed
- Mark Topic as New
- Mark Topic as Read
- Float this Topic for Current User
- Bookmark
- Subscribe
- Mute
- Printer Friendly Page
- Mark as New
- Bookmark
- Subscribe
- Mute
- Subscribe to RSS Feed
- Permalink
- Report Inappropriate Content
Two line charts with set analysis are behaving differently when a selection is made on the chart
Dimension
=MonthName([ReqDt])
Expression for Line Chart
=Count(
{<
[ReqDt]={'>=$(=vBegDateLast24thMonth)<=$(=vEndDateThisMonth)'},
[MDT]={'Val1', 'Val2'},
[SDT]={'Val3', 'Val4'}
>}
[ID])
Expression for Average Line Chart
=Round(Avg(TOTAL Aggr(Count(
{<
[ReqDt]={'>=$(=vBegDateLast24thMonth)<=$(=vEndDateThisMonth)'},
[MDT]={'Val1', 'Val2'},
[SDT]={'Val3', 'Val4'}
>}
[ID]), [ReqDt Date Year], [ReqDt DateMonth])))
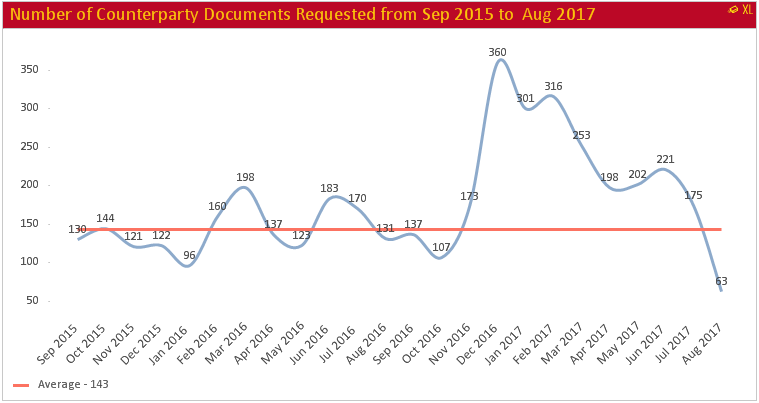
Chart when no selection is made

Chart when some month selection is done from chart
This image is showing month selection
This image is showing resulting chart

I'm trying to understand why Average Line chart reflects selection where as the other chart is still showing the original chart. Though both expressions (Line and Average) are using same set analysis criteria.
Let me know if any additional information is needed.
Any guidance will be helpful.
Thanks & Regards,
Vijay
Accepted Solutions
- Mark as New
- Bookmark
- Subscribe
- Mute
- Subscribe to RSS Feed
- Permalink
- Report Inappropriate Content
The second one isn't using the same criteria.... for them to use the same criteria, you need set analysis in the outer aggregation as well
=Round(Avg(TOTAL
{<
[ReqDt]={'>=$(=vBegDateLast24thMonth)<=$(=vEndDateThisMonth)'},
[MDT]={'Val1', 'Val2'},
[SDT]={'Val3', 'Val4'}
>}
Aggr(Count(
{<
[ReqDt]={'>=$(=vBegDateLast24thMonth)<=$(=vEndDateThisMonth)'},
[MDT]={'Val1', 'Val2'},
[SDT]={'Val3', 'Val4'}
>}
[ID]), [ReqDt Date Year], [ReqDt DateMonth])))
- Mark as New
- Bookmark
- Subscribe
- Mute
- Subscribe to RSS Feed
- Permalink
- Report Inappropriate Content
Hi Sunny,
As always thanks for your prompt and useful response.
Thanks & Regards,
Vijay