Unlock a world of possibilities! Login now and discover the exclusive benefits awaiting you.
- Qlik Community
- :
- All Forums
- :
- QlikView App Dev
- :
- Re: Unhide unselected columns from a table box
- Subscribe to RSS Feed
- Mark Topic as New
- Mark Topic as Read
- Float this Topic for Current User
- Bookmark
- Subscribe
- Mute
- Printer Friendly Page
- Mark as New
- Bookmark
- Subscribe
- Mute
- Subscribe to RSS Feed
- Permalink
- Report Inappropriate Content
Unhide unselected columns from a table box
From a sheet I made a bar chart and a table box.
When I clicked a column from the table box, All unselected colums are removed from both charts.
How should I fix the table box to unhide unselected columns.
HELP!! ASAP!! 😉
- Tags:
- new_to_qlikview
- Mark as New
- Bookmark
- Subscribe
- Mute
- Subscribe to RSS Feed
- Permalink
- Report Inappropriate Content
Can you post a sample app?
- Mark as New
- Bookmark
- Subscribe
- Mute
- Subscribe to RSS Feed
- Permalink
- Report Inappropriate Content
Hi Sundo,
In chart it can be achived by using set analysis.
Please find the attachment with an example.
-Sundar
- Mark as New
- Bookmark
- Subscribe
- Mute
- Subscribe to RSS Feed
- Permalink
- Report Inappropriate Content
if you click a column it will hide as qlikview behaves like that it filters the data which you click
however you can lock a graph for click by giving in set analysis like for example : sum({<Year=>}sales)
so if you have a list box or table box and you go on clicking Year then it will not affect bar chart or that chart.
anant
- Mark as New
- Bookmark
- Subscribe
- Mute
- Subscribe to RSS Feed
- Permalink
- Report Inappropriate Content
Hi,
please check this link. may be it will helpful for you.
http://community.qlik.com/docs/DOC-5404
Thanks,
Ashutosh
- Mark as New
- Bookmark
- Subscribe
- Mute
- Subscribe to RSS Feed
- Permalink
- Report Inappropriate Content
 Hi Sundo,
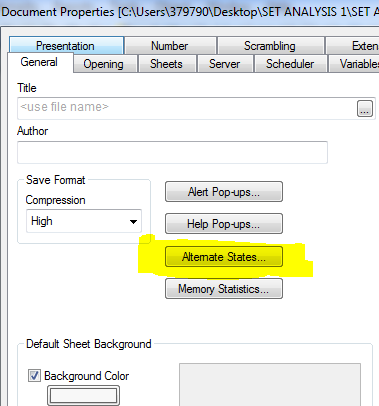
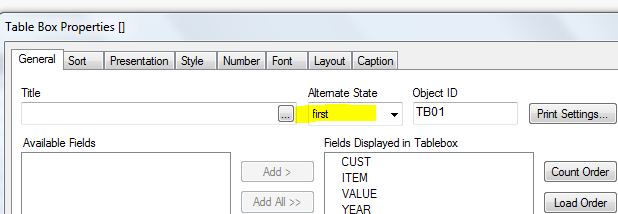
That can be achived by alternate states.
Please find the attachement...
I have used two alternate states first and second...
alternate states should be enabled in documnet properties.