Unlock a world of possibilities! Login now and discover the exclusive benefits awaiting you.
- Qlik Community
- :
- All Forums
- :
- QlikView App Dev
- :
- Using Desc/Asc in Expressions
- Subscribe to RSS Feed
- Mark Topic as New
- Mark Topic as Read
- Float this Topic for Current User
- Bookmark
- Subscribe
- Mute
- Printer Friendly Page
- Mark as New
- Bookmark
- Subscribe
- Mute
- Subscribe to RSS Feed
- Permalink
- Report Inappropriate Content
Using Desc/Asc in Expressions
Hello everyone,
I got a lot of help with my other discussion so thank you for the support, but here I am with another question. Sorry if I open a lot of discussions but I am very new with QlickView.
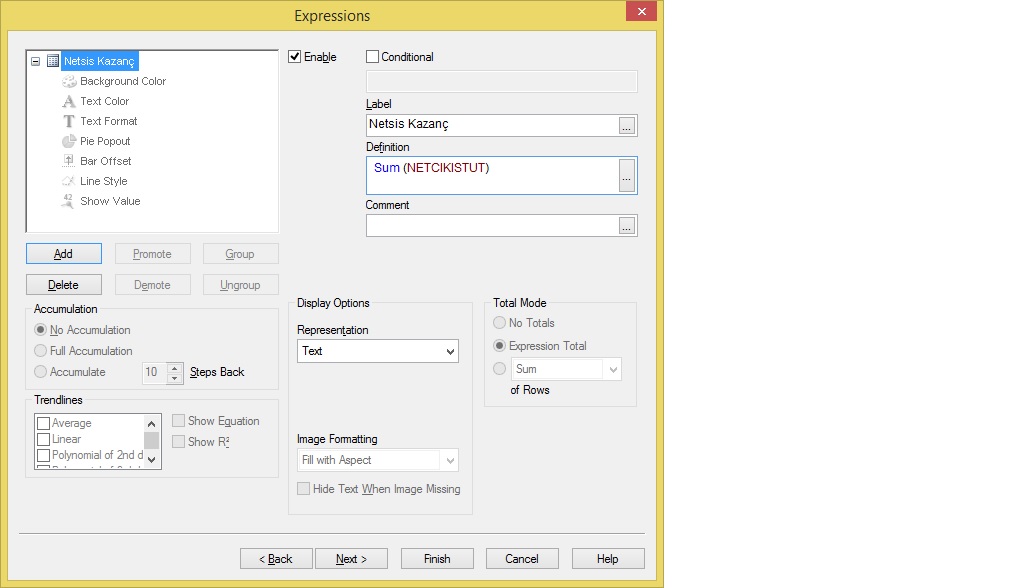
I added an Expressions to a new SheetObject from Chart Pivot Table. I added the SUM but I want to use ASCENDING/DESCENDING on it but I cannot seem to find nor how to do it. I want higher values to be on top, lower values to be on bottom.
Thanks in advance.
- Tags:
- new_to_qlikview
Accepted Solutions
- Mark as New
- Bookmark
- Subscribe
- Mute
- Subscribe to RSS Feed
- Permalink
- Report Inappropriate Content
Update check now
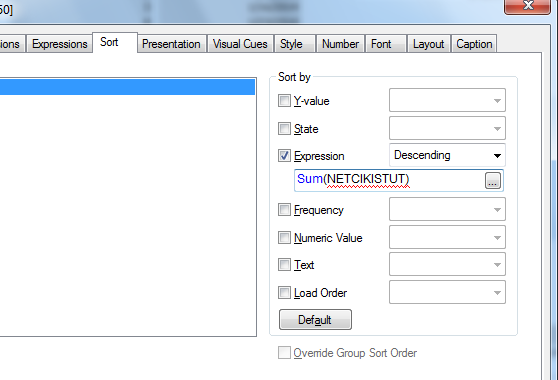
Go to chart properties >> Sort >> Expression and paste your expression there and select descending
See snap
- Mark as New
- Bookmark
- Subscribe
- Mute
- Subscribe to RSS Feed
- Permalink
- Report Inappropriate Content
you have to go to the sort page and define sort oder there
- Mark as New
- Bookmark
- Subscribe
- Mute
- Subscribe to RSS Feed
- Permalink
- Report Inappropriate Content
Update check now
Go to chart properties >> Sort >> Expression and paste your expression there and select descending
See snap
- Mark as New
- Bookmark
- Subscribe
- Mute
- Subscribe to RSS Feed
- Permalink
- Report Inappropriate Content
The thing is I don't see the NETCIKISTUT there. Do I need to add that field and use the sort from there? will it effect the SUM(NETCIKISTUT) ?
- Mark as New
- Bookmark
- Subscribe
- Mute
- Subscribe to RSS Feed
- Permalink
- Report Inappropriate Content
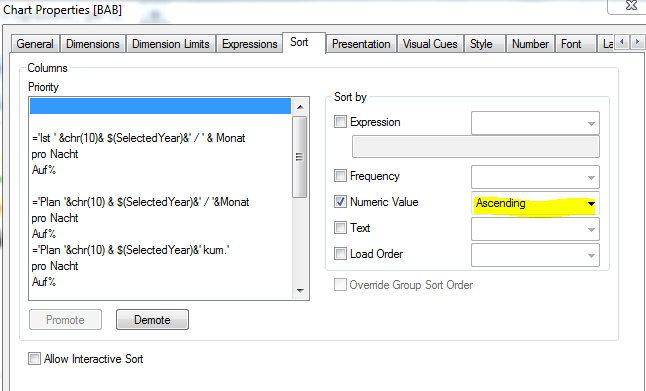
There are some restriction in PIVOT Table Sorting..You can only do sorting on One Dimension ..... at a time.. better to use straight table
- Mark as New
- Bookmark
- Subscribe
- Mute
- Subscribe to RSS Feed
- Permalink
- Report Inappropriate Content
You can sort on the basis of the Dimension but based on expression you can sort the table for this go to
Chart properties >> Sort >> Un check all >> tick on expression >> and paste there your expression Sum(NETCIKISTUT) and select descending.
Hope this helps
- Mark as New
- Bookmark
- Subscribe
- Mute
- Subscribe to RSS Feed
- Permalink
- Report Inappropriate Content
Updated:
Thank you all for the help. I got it figured out 