Unlock a world of possibilities! Login now and discover the exclusive benefits awaiting you.
- Qlik Community
- :
- All Forums
- :
- QlikView App Dev
- :
- Re: Using accumulated values in chart for calculat...
- Subscribe to RSS Feed
- Mark Topic as New
- Mark Topic as Read
- Float this Topic for Current User
- Bookmark
- Subscribe
- Mute
- Printer Friendly Page
- Mark as New
- Bookmark
- Subscribe
- Mute
- Subscribe to RSS Feed
- Permalink
- Report Inappropriate Content
Using accumulated values in chart for calculation is not working
Hi,
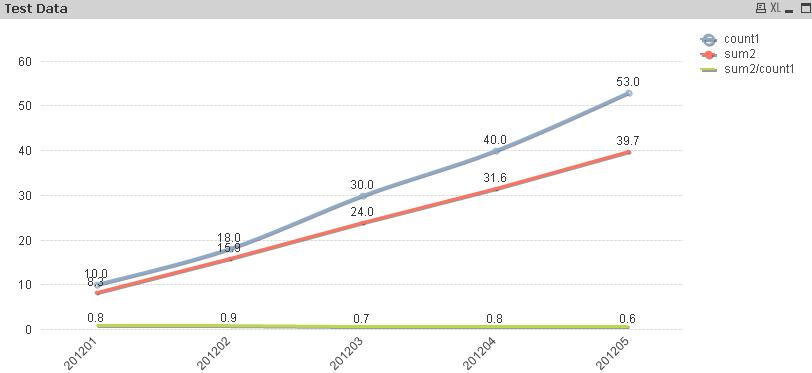
I have 2 accumulated values in my chart.
When I tried to use the 2 values to calculated a 3rd value with the formula (=sum2/count1), the result is wrong.
For example, for the last result: sum2/count1 = 53.0/39.7 should be 0.74 and not 0.6.
QV seems to ignore the accumulated values and use back the original values.
Any help to calculate the correct result is greatly appreciate 
Accepted Solutions
- Mark as New
- Bookmark
- Subscribe
- Mute
- Subscribe to RSS Feed
- Permalink
- Report Inappropriate Content
Yes, it will use the actual values for the data points, not the accumulated range.
You'll need to modify the expressions to actually calculate the accumulated value.
For example, if the dimension is YearMonth and your expression is Sum(Sales), you could do something like:
rangesum(above(Sum(Sales), 0, Rowno()))
This would calculate the rangesum starting from the current "row" and adding as many previous ones as you have values in your dimension up to this point.
- Mark as New
- Bookmark
- Subscribe
- Mute
- Subscribe to RSS Feed
- Permalink
- Report Inappropriate Content
Thanks for your help!
But how do I only accumulate the past 3 value?
I tired the below, but the result is not good.
rangesum(above(Sum(Sales), Rowno()-3, Rowno()))
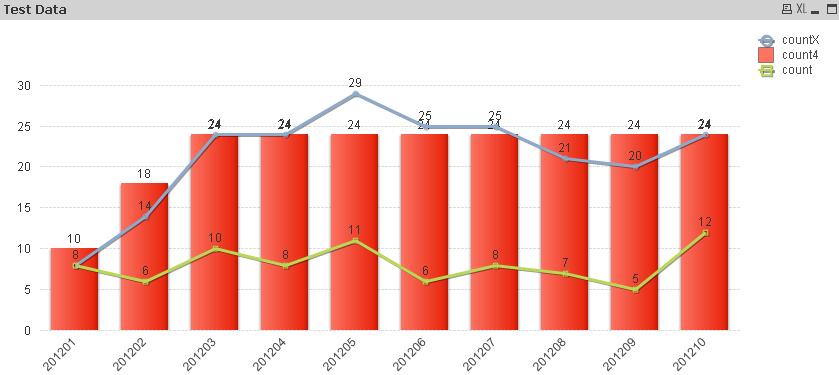
Bule line is the correct result using qv chart accumulation=3. Green line is the actual number
Red bar is my bad calculation
- Mark as New
- Bookmark
- Subscribe
- Mute
- Subscribe to RSS Feed
- Permalink
- Report Inappropriate Content
Hi,
Try:
rangesum(above(Sum(Sales), 0, 3))
- Mark as New
- Bookmark
- Subscribe
- Mute
- Subscribe to RSS Feed
- Permalink
- Report Inappropriate Content
It works! Your are great! 
- Mark as New
- Bookmark
- Subscribe
- Mute
- Subscribe to RSS Feed
- Permalink
- Report Inappropriate Content
Hello,
I'm a newbie on Qlik View but I have to face a particular requirement on this moment.
The user is asking to have the possibility to zoom over a line chart to go in a more detailed and filtered graph.
At the moment QV do it but the initial value of new zoomed detailed graph is always 0.
Is there a trik to mantain, as initial value, the cumulated valued present on original graph ?
I hope you will understand ... my question... ;-))
I replayed here becouse the topic seems similar.
Many thank
Giovanni