Unlock a world of possibilities! Login now and discover the exclusive benefits awaiting you.
- Qlik Community
- :
- All Forums
- :
- QlikView App Dev
- :
- Re: Using calculated dimensions to dictate what ro...
- Subscribe to RSS Feed
- Mark Topic as New
- Mark Topic as Read
- Float this Topic for Current User
- Bookmark
- Subscribe
- Mute
- Printer Friendly Page
- Mark as New
- Bookmark
- Subscribe
- Mute
- Subscribe to RSS Feed
- Permalink
- Report Inappropriate Content
Using calculated dimensions to dictate what rows to display in straight chart
I'm hoping someone can point out where I'm going wrong as I've spend a day on this and can't quite nail it down.
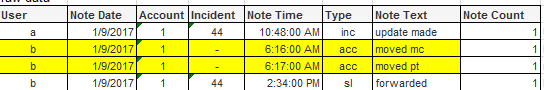
Here is the raw data I have:
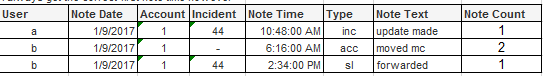
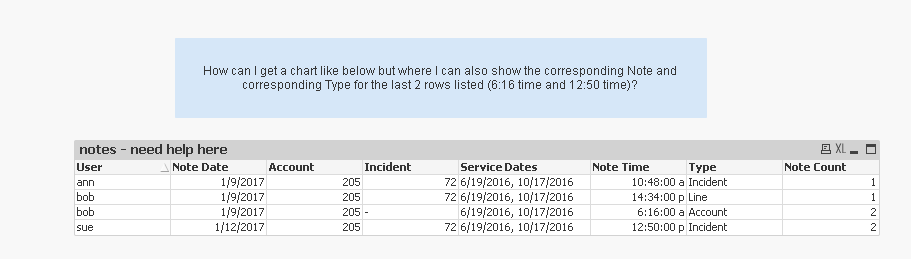
My desired result is the following: show the first note time with its corresponding type and text, grouped by user, date, account and incident, and then also include the number of notes at that grouping
my dimensions are: User, Note Date, Account, Incident, Type, Note Text, and 2 calculated dimensions…described below
1) Note Time - which is going to be first note time with this aggr statement, and the set analysis is just looking for notes withing within a date range set in 2 input boxes, and notes that ...
Aggr(
Min(
{$<[Note Date]={"$(= '>=' & vNoteStartDate) $(= '<=' & vNoteEndDate)"},[ExcludeNoteFlag]={'No'}>}
[Note Time]),
[User], [Note Date], [Account], [Incident])
2) show row flag - this is used to conditionally show the row by checking the dimension to Suppress When Value is Null, nad by setting the field on the Presentation tab to Hide
Aggr()
If([Note Time] = Min({$<[Note Date]={"$(= '>=' & vNoteStartDate) $(= '<=' & vNoteEndDate)"},[ExcludeNoteFlag]={'No'}>}[Note Time]),'Yes'),
[User], [Note Date], [Account], [Incident])
AND my expression for note count is:
Aggr(
count(
{$<[Note Date]={"$(= '>=' & vNoteStartDate) $(= '<=' & vNoteEndDate)"},[ExcludeNoteFlag]={'No'}>} [NoteCounter]),
[User], [Note Date], [Account], [Incident])
But for some reason I sometimes get this as the result and I don't know why, where the yellow cells are null:
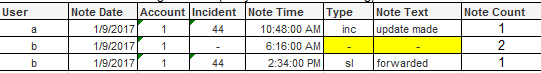
Any advice on what to try would be greatly appreciated. Thanks in advance.
Accepted Solutions
- Mark as New
- Bookmark
- Subscribe
- Mute
- Subscribe to RSS Feed
- Permalink
- Report Inappropriate Content
- Mark as New
- Bookmark
- Subscribe
- Mute
- Subscribe to RSS Feed
- Permalink
- Report Inappropriate Content
I've attached a sample qvw if anyone want to take a stab at this for me. Thanks.
- Mark as New
- Bookmark
- Subscribe
- Mute
- Subscribe to RSS Feed
- Permalink
- Report Inappropriate Content
Is there a reason you are using Note Time and Note Text as dimension, would you be okay to use them as expressions?
- Mark as New
- Bookmark
- Subscribe
- Mute
- Subscribe to RSS Feed
- Permalink
- Report Inappropriate Content
This?
- Mark as New
- Bookmark
- Subscribe
- Mute
- Subscribe to RSS Feed
- Permalink
- Report Inappropriate Content
To answer your question about using expressions...I think it is just my old school way of thinking regarding what is a dimension and what is a fact/measure/expression so I just never entertained this approach. Your qvw seems to work nicely (and surprisingly easy), thank you so much. Just one question, however, could this break if the sort changes either by the user double clicking a column header of the chart or if the Sort tab in the properties for the chart changes? I'm not that familiar with how FirstSortedValue works and if it is has certain dependencies. Thanks.
- Mark as New
- Bookmark
- Subscribe
- Mute
- Subscribe to RSS Feed
- Permalink
- Report Inappropriate Content
The result of the table won't change based on the sorting of the table. FirstSortedValue uses the second parameter to sort rather than sorting based on the table. I used this
=FirstSortedValue(Type, [Note Time])
Since the Note Time is positive, the expression will pick the Type where Note Time is the minimum. If I instead used this
=FirstSortedValue(Type, -[Note Time])
the expression would have picked the type where Note time is the highest (note the negative sign to tell the expression that sorting is needed in descending order)