Unlock a world of possibilities! Login now and discover the exclusive benefits awaiting you.
- Qlik Community
- :
- All Forums
- :
- QlikView App Dev
- :
- Re: Value Points- Either Inside or Outside
- Subscribe to RSS Feed
- Mark Topic as New
- Mark Topic as Read
- Float this Topic for Current User
- Bookmark
- Subscribe
- Mute
- Printer Friendly Page
- Mark as New
- Bookmark
- Subscribe
- Mute
- Subscribe to RSS Feed
- Permalink
- Report Inappropriate Content
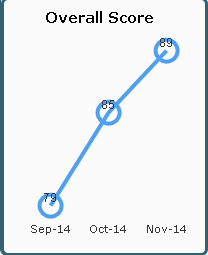
Value Points- Either Inside or Outside
Hi All,
I have a Line Graph like this below and I am showing the values for each Month.
By any means, can the values (79,85,89) be displayed inside the circle, and if not, outside the circle (top of circle)?
Can we increase the font size of the values as well?
Please guide.
- Tags:
- line-chart
- Mark as New
- Bookmark
- Subscribe
- Mute
- Subscribe to RSS Feed
- Permalink
- Report Inappropriate Content
You can change the font size by setting the Expression Axis font on the Axes pane.
You can move the numbers up by generating a second expression of linefeeds like
=repeat(chr(10),2)
For this expression, uncheck Line and Symbol but select Values on Data Points.
See attached example qvw.

Also see:
Qlikview Cookbook: Tutorial - Annotating Chart Data Points http://qlikviewcookbook.com/recipes/download-info/tutorial-annotating-chart-data-points/ for some addtional tips.
-Rob