Unlock a world of possibilities! Login now and discover the exclusive benefits awaiting you.
- Qlik Community
- :
- All Forums
- :
- QlikView App Dev
- :
- Re: Value inside the bars of a bar chart
- Subscribe to RSS Feed
- Mark Topic as New
- Mark Topic as Read
- Float this Topic for Current User
- Bookmark
- Subscribe
- Mute
- Printer Friendly Page
- Mark as New
- Bookmark
- Subscribe
- Mute
- Subscribe to RSS Feed
- Permalink
- Report Inappropriate Content
Value inside the bars of a bar chart
I believe this question has been answered elsewhere, but I've failed to find it.
I have a bar chart and have checked the option to show Values on Data Points which works fine.
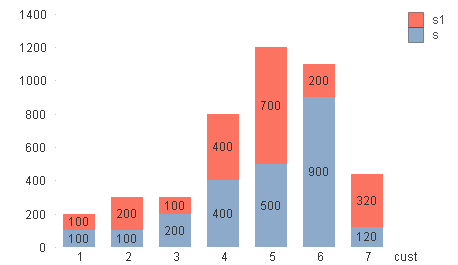
But please can you tell me how to show the Values inside the bars, rather than above them ?
Can I show a different expression value inside the bar?
Thanks
Richard
- « Previous Replies
-
- 1
- 2
- Next Replies »
Accepted Solutions
- Mark as New
- Bookmark
- Subscribe
- Mute
- Subscribe to RSS Feed
- Permalink
- Report Inappropriate Content
Hi Richard,
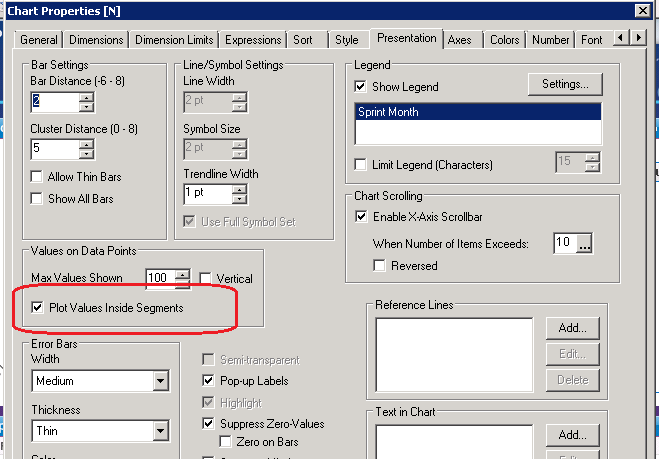
Please go to presentation tab and select plot inside the segment this will do your requirement 
- Mark as New
- Bookmark
- Subscribe
- Mute
- Subscribe to RSS Feed
- Permalink
- Report Inappropriate Content
Hi Richard,
Please go to presentation tab and select plot inside the segment this will do your requirement 
- Mark as New
- Bookmark
- Subscribe
- Mute
- Subscribe to RSS Feed
- Permalink
- Report Inappropriate Content
Thank you.
I had a feeling it was a simple solution ![]()
- Mark as New
- Bookmark
- Subscribe
- Mute
- Subscribe to RSS Feed
- Permalink
- Report Inappropriate Content
Yes, your rite. Its the feature of Qlikview ![]()
- Mark as New
- Bookmark
- Subscribe
- Mute
- Subscribe to RSS Feed
- Permalink
- Report Inappropriate Content
This was helpful as the feature is easily overlooked.
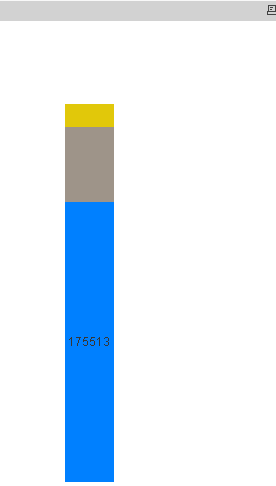
However, I have a stacked bar chart and the value is only plotted in one (the first) bar and not in any others.
Any ideas why?
- Mark as New
- Bookmark
- Subscribe
- Mute
- Subscribe to RSS Feed
- Permalink
- Report Inappropriate Content
Hi,
Go to expression tab and check the show value on the data points, think this should sever the purpose.
- Mark as New
- Bookmark
- Subscribe
- Mute
- Subscribe to RSS Feed
- Permalink
- Report Inappropriate Content
...it still shows on only one data point.
- Mark as New
- Bookmark
- Subscribe
- Mute
- Subscribe to RSS Feed
- Permalink
- Report Inappropriate Content
can you share the app , let me check .
- Mark as New
- Bookmark
- Subscribe
- Mute
- Subscribe to RSS Feed
- Permalink
- Report Inappropriate Content

 Hi Richard,
one possible problem is when there is not enough space to display values inside the plot area they are not shown up, will you try to increase the size of chart? if not try once
- Mark as New
- Bookmark
- Subscribe
- Mute
- Subscribe to RSS Feed
- Permalink
- Report Inappropriate Content

Hi
Here is my chart - I think you'll agree there is plenty of space for the silver and gold values.
- « Previous Replies
-
- 1
- 2
- Next Replies »