Unlock a world of possibilities! Login now and discover the exclusive benefits awaiting you.
- Qlik Community
- :
- All Forums
- :
- QlikView App Dev
- :
- Re: Value on top of bar chart is not showing for a...
- Subscribe to RSS Feed
- Mark Topic as New
- Mark Topic as Read
- Float this Topic for Current User
- Bookmark
- Subscribe
- Mute
- Printer Friendly Page
- Mark as New
- Bookmark
- Subscribe
- Mute
- Subscribe to RSS Feed
- Permalink
- Report Inappropriate Content
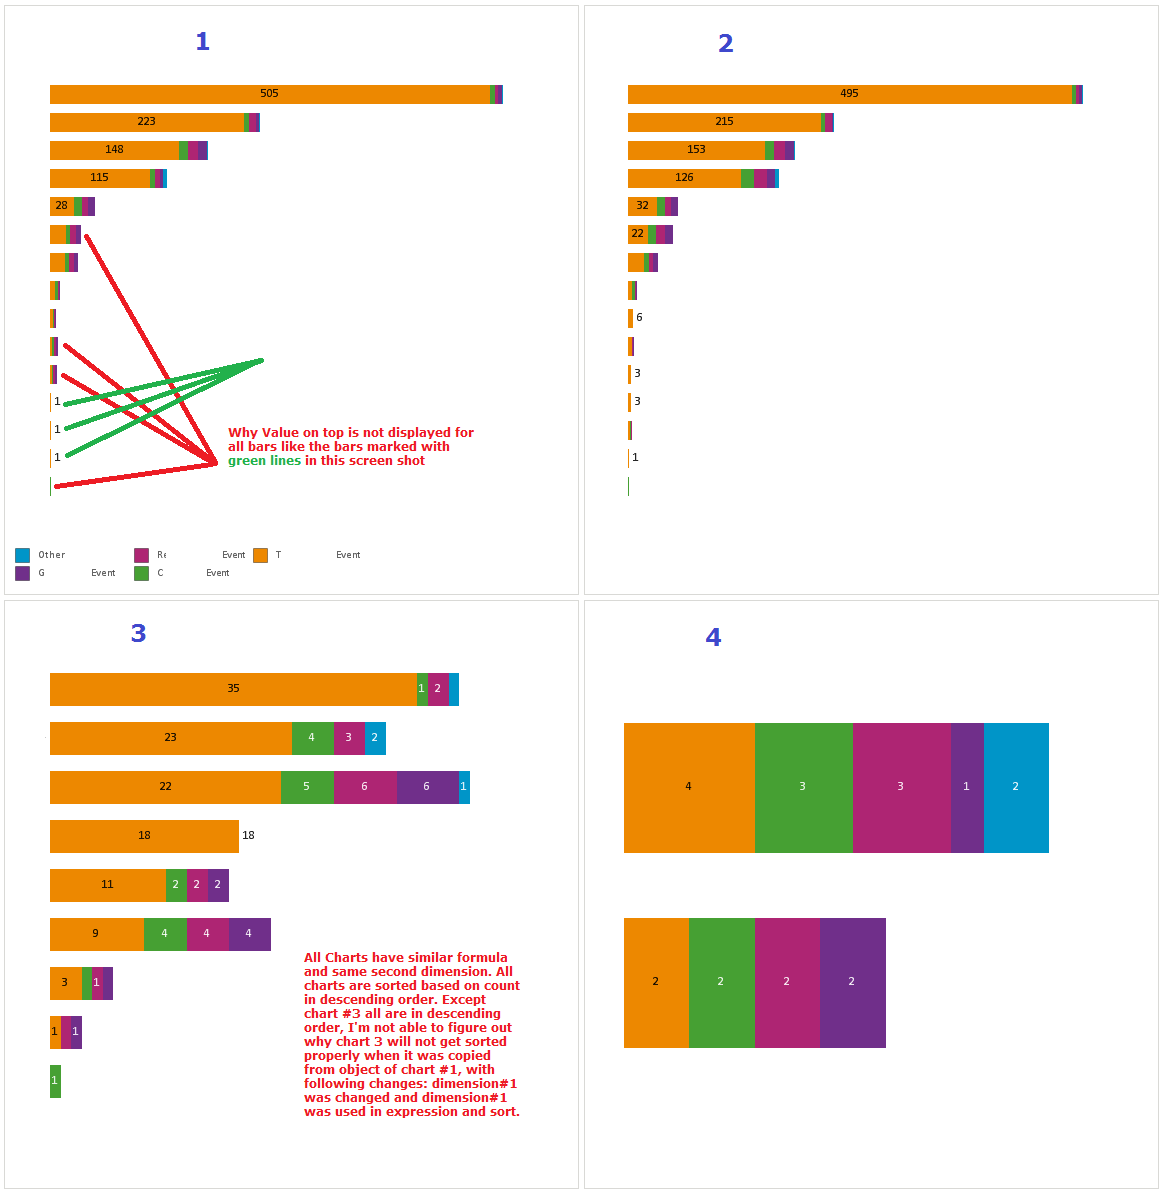
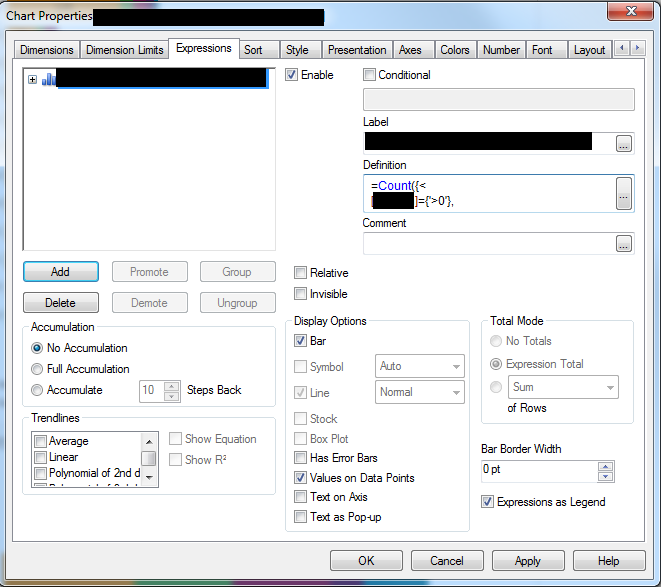
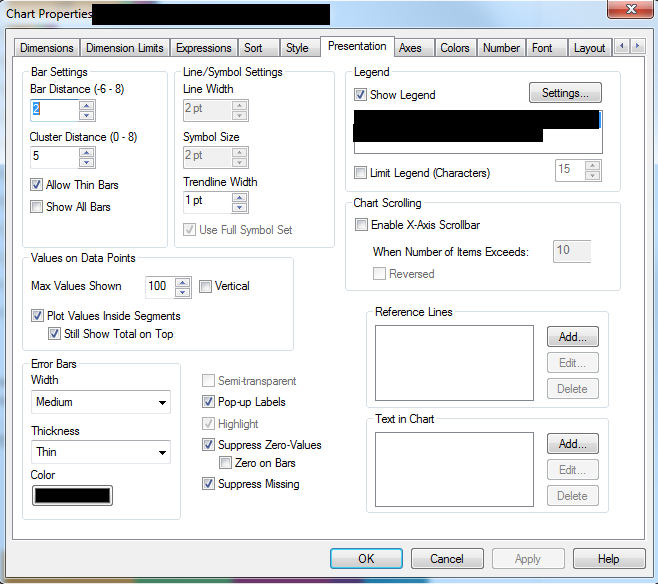
Value on top of bar chart is not showing for all bars and sort is not working for one of them
Hi,
I've four bar charts with same/similar formula except the dimension used in them is replaced
Formulas are as follows for
Expression Chart#1
=Count({<
[Dimension1]={'>0'},
[Dimnesion4]={Value1*',Value2*'},
[BarChartDimension1-1]-={'-'}
>}
[Dimension6])
Sort Chart#1
=Count({<
[Dimension1]={'>0'},
[Dimnesion4]={Value1*',Value2*'},
[BarChartDimension1-1]-={'-'},
[BarChartDimension2]={'*'}
>}
[Dimension6])
Expression Chart#2
=Count({<
[Dimension1]={'>0'},
[Dimnesion4]={Value1*',Value2*'},
[BarChartDimension2-1]-={'-'}
>}
[Dimension6])
Sort Chart#1
=Count({<
[Dimension1]={'>0'},
[Dimnesion4]={Value1*',Value2*'},
[BarChartDimension2-1]-={'-'},
[BarChartDimension2]={'*'}
>}
[Dimension6])
Expression Chart#3
=Count({<
[Dimension1]={'>0'},
[Dimnesion4]={Value1*',Value2*'},
[BarChartDimension3-1]-={'-'}
>}
[Dimension6])
Sort Chart#1
=Count({<
[Dimension1]={'>0'},
[Dimnesion4]={Value1*',Value2*'},
[BarChartDimension3-1]-={'-'},
[BarChartDimension2]={'*'}
>}
[Dimension6])
Expression Chart#4
=Count({<
[Dimension1]={'>0'},
[Dimnesion4]={Value1*',Value2*'},
[BarChartDimension4-1]-={'-'}
>}
[Dimension6])
Sort Chart#4
=Count({<
[Dimension1]={'>0'},
[Dimnesion4]={Value1*',Value2*'},
[BarChartDimension4-1]-={'-'},
[BarChartDimension2]={'*'}
>}
[Dimension6])
On Sort except expression all other check box are unchecked for both dimensions (i.e. BarChartDimensionN-1, BarChartDimension2)
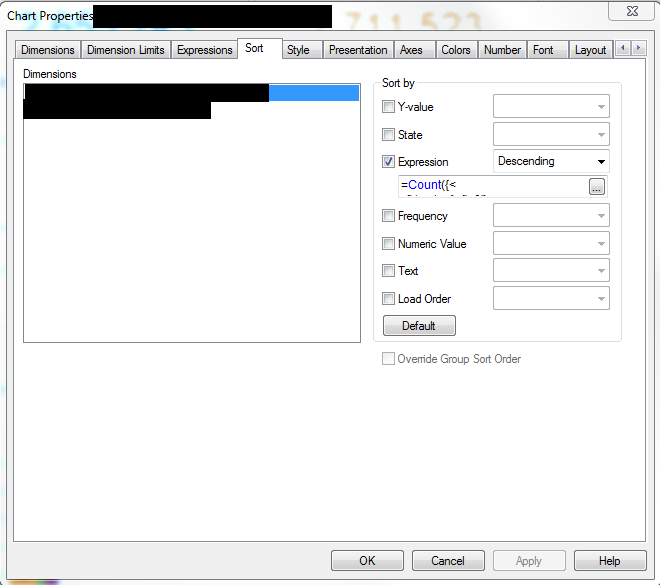
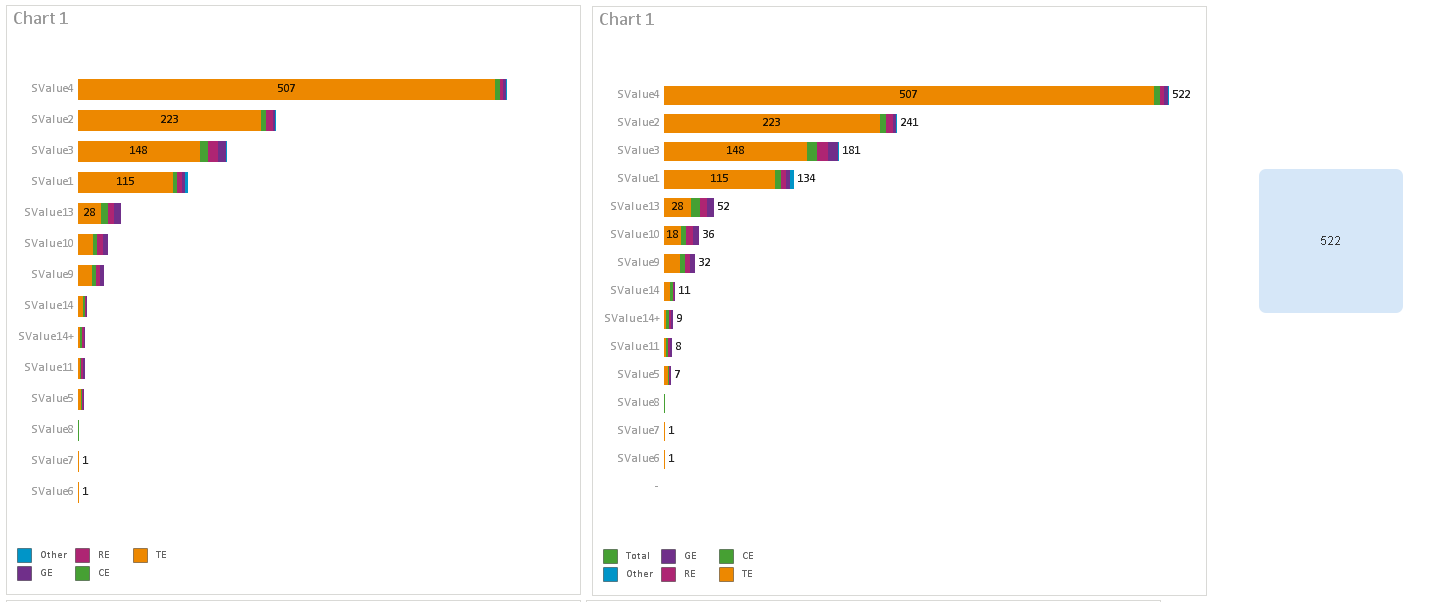
But sort on Chart #3 is not working. Values on top of most bar is not showing up except when second dimension value is equal to orange color
I'm having difficult time to figure out the reason. Tried few changes but none of them seems to be working. Please review screen shots below
Any help/guidance will be appreciable.
Thanks,
Vijay
- « Previous Replies
-
- 1
- 2
- Next Replies »
- Mark as New
- Bookmark
- Subscribe
- Mute
- Subscribe to RSS Feed
- Permalink
- Report Inappropriate Content
This
=Max(Aggr(Count({< [Version]={'>0'}, [ATDS]={'EDC*','CiMark*'}, [T_S]-={'-'} >} [AT]), T_S))
- Mark as New
- Bookmark
- Subscribe
- Mute
- Subscribe to RSS Feed
- Permalink
- Report Inappropriate Content
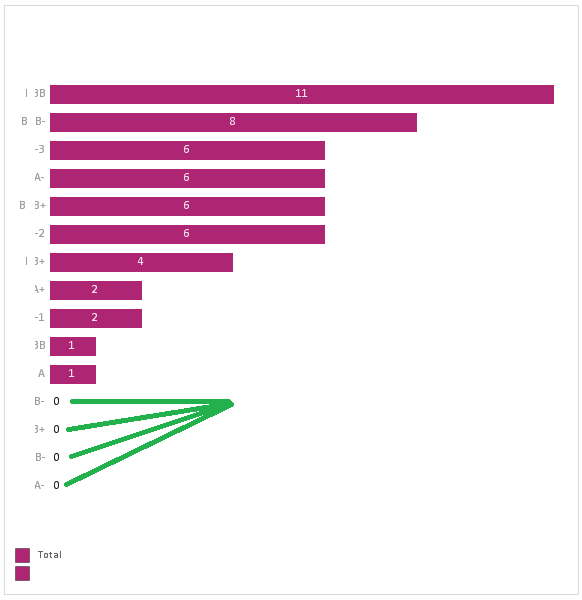
it is almost working .... just one more item on this... will it be possible to not display the one with 0 when a selection is made and that results in 0 count for a dimensional value as seen in screen shot
- Mark as New
- Bookmark
- Subscribe
- Mute
- Subscribe to RSS Feed
- Permalink
- Report Inappropriate Content
Hi Sunny,
Some how I missed seeing your attachment while I was looking at this reply hence I asked you to share the info. Now when I refreshed my webpage I saw the QVW you had attached with your example.
My apology for not seeing it and asking the question.
Regards,
Vijay
- Mark as New
- Bookmark
- Subscribe
- Mute
- Subscribe to RSS Feed
- Permalink
- Report Inappropriate Content
So are we good to close this thread then? Please close this thread if you got what you wanted
Best,
Sunny
- Mark as New
- Bookmark
- Subscribe
- Mute
- Subscribe to RSS Feed
- Permalink
- Report Inappropriate Content
Hi Sunny,
There is one question., probably it got mixed up in my responses to your earlier replies..
It is the one Jul 25, 2017 4:38 PM with following info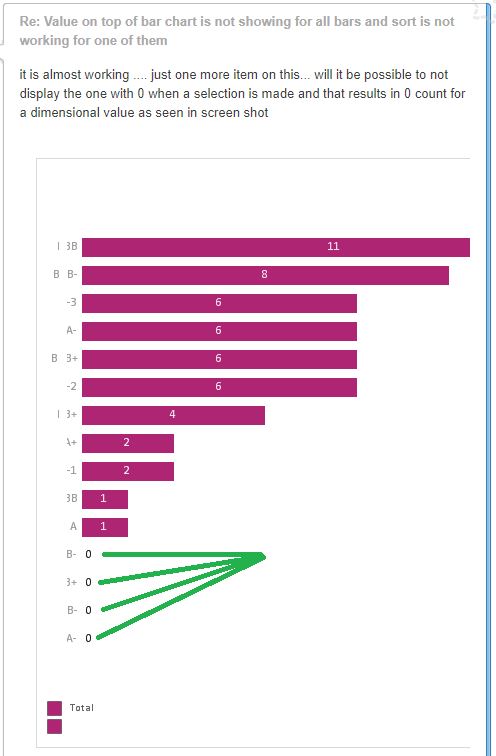
- Mark as New
- Bookmark
- Subscribe
- Mute
- Subscribe to RSS Feed
- Permalink
- Report Inappropriate Content
Is 'Suppress Zero Value' selected on the presentation tab? If it is, I wonder why it still show up. May be clone your bar chart and convert the cloned object into a straight table to see if the values are truly 0 or if they have a really small value which might be causing them to show here.
Alternatively, share a sample file with me where I can see the issue to help you better.
Best,
Sunny
- Mark as New
- Bookmark
- Subscribe
- Mute
- Subscribe to RSS Feed
- Permalink
- Report Inappropriate Content
Hi Sunny,
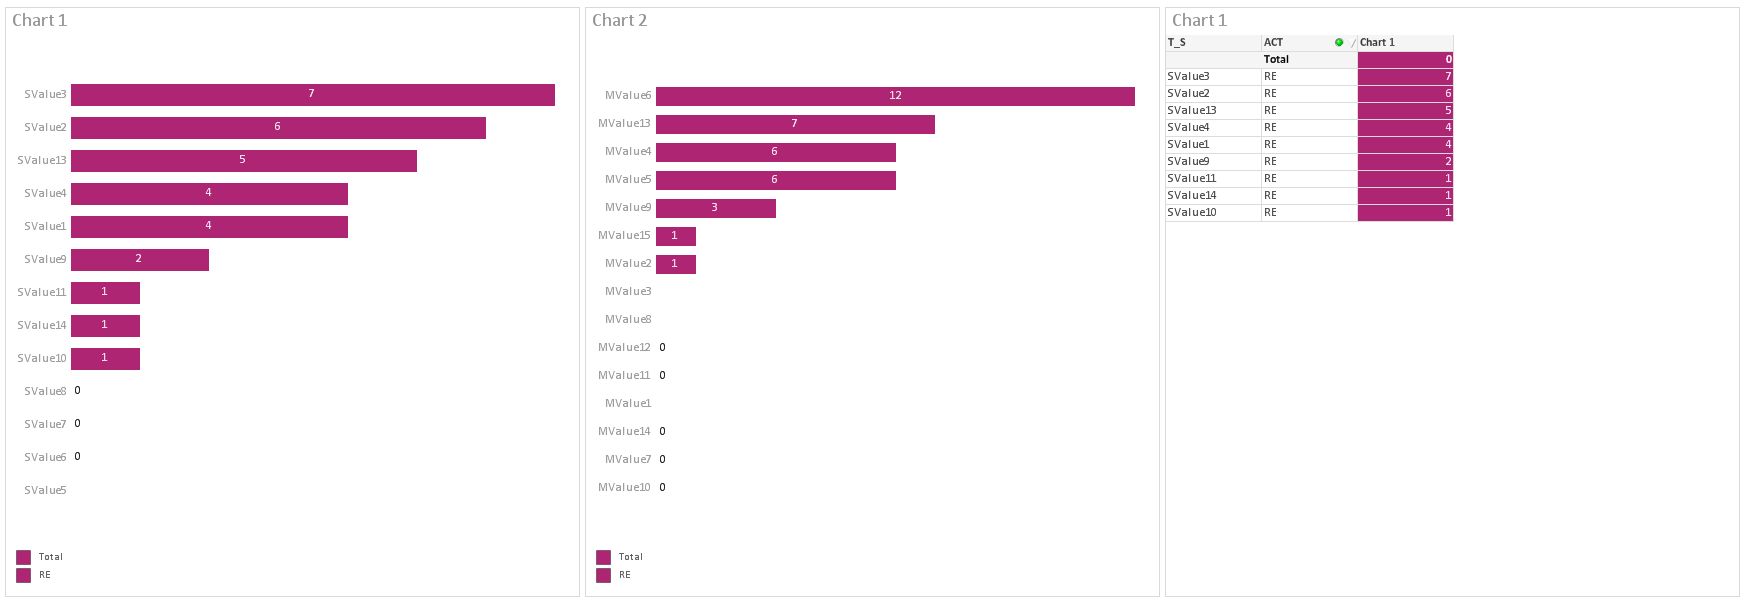
Good morning. As per your advice I've verified 'Suppress Zero Value' flag and it was checked. Also I've created a straight table for one of the chart to verify that there are no 0 records.
I'm seeing some strange behavior for e.g. in Chart 2 when no selections are made than total for MValue12 is not seen even though there is a count of 1 associated with CE (Green color). MValue 1 should not be seen as its Total is 0
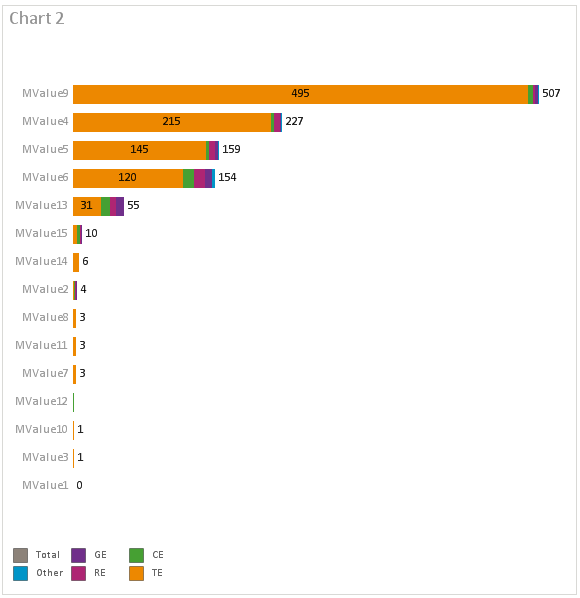
Now when we select RE there is similar situation
I'm attaching data and QVW file for your reference.
- Mark as New
- Bookmark
- Subscribe
- Mute
- Subscribe to RSS Feed
- Permalink
- Report Inappropriate Content
I guess I am not sure how to show the total for MValue12, but the 0 bar is removed from the bar chart using calculated dimension....
- Mark as New
- Bookmark
- Subscribe
- Mute
- Subscribe to RSS Feed
- Permalink
- Report Inappropriate Content
Hi Sunny,
Thanks for all your help and advise. Just a curiosity question. What is a good way to master or how to enhance QlikView knowledge. How you come up with a solution so quickly?
As I can mark only one correct answer I'll select the last one but there were several different question in this post and they were answered in different responses.
Best Regards,
Vijay
- Mark as New
- Bookmark
- Subscribe
- Mute
- Subscribe to RSS Feed
- Permalink
- Report Inappropriate Content
The best way to learn is to learn by helping others, at least that is how I learned most of my QlikView over the last 2 years. I didn't always had the best responses, but seeing other people's responses, I managed to get better and better.
You can always mark Helpful responses as those also help future visitors to look at the responses which might be helpful for them to look at.
Qlik Community Tip: Marking Replies as Correct or Helpful
Best,
Sunny
- « Previous Replies
-
- 1
- 2
- Next Replies »