Unlock a world of possibilities! Login now and discover the exclusive benefits awaiting you.
- Qlik Community
- :
- All Forums
- :
- QlikView App Dev
- :
- Re: Values to breakup in Chart / Table
- Subscribe to RSS Feed
- Mark Topic as New
- Mark Topic as Read
- Float this Topic for Current User
- Bookmark
- Subscribe
- Mute
- Printer Friendly Page
- Mark as New
- Bookmark
- Subscribe
- Mute
- Subscribe to RSS Feed
- Permalink
- Report Inappropriate Content
Values to breakup in Chart / Table
Hi all,
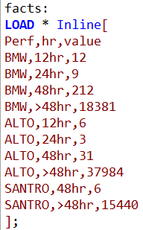
I am getting this Result.
From here, Need to enable the result to show the given way.
Please find the enclosed attachment for deriving the specific Result.
0- 12 hrs Performance ( 12hr)
0-24 hrs Performance ( 12hr+24hr )
0-48 hrs Performance (12hr+24hr+48hr)
no need to show >48 hr performance ... but it should consider in % in Performance and total Quantity.
Thanks
Vepuri
- Subscribe by Topic:
-
Application Development
-
Creating Analytics
-
Layout & Visualizations
-
Other
-
Scripting
- Mark as New
- Bookmark
- Subscribe
- Mute
- Subscribe to RSS Feed
- Permalink
- Report Inappropriate Content
Hello, Lakshman.
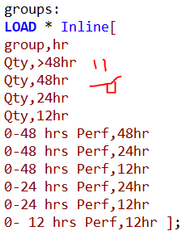
If you need additional groups,so create it in your model, use
Load Inline[hr_group,hr
...
0-24 hrs Perf, 24hr
0-24 hrs Perf, 12hr
0- 12 hrs Perf, 12hr
] in your script
Expression (%) in your green table looks like Sum (value)/Sum (Total <Perf> value)) 👍😉
- Mark as New
- Bookmark
- Subscribe
- Mute
- Subscribe to RSS Feed
- Permalink
- Report Inappropriate Content
Hi @Igoresz ,
Tried the same, but not getting the result as expected.
Please help to take the input given and upload the sample qvw file.
Thanks
Lakshman


