Unlock a world of possibilities! Login now and discover the exclusive benefits awaiting you.
- Qlik Community
- :
- All Forums
- :
- QlikView App Dev
- :
- Variables/Calculation in load script
- Subscribe to RSS Feed
- Mark Topic as New
- Mark Topic as Read
- Float this Topic for Current User
- Bookmark
- Subscribe
- Mute
- Printer Friendly Page
- Mark as New
- Bookmark
- Subscribe
- Mute
- Subscribe to RSS Feed
- Permalink
- Report Inappropriate Content
Variables/Calculation in load script
Hello,
I am struggling to find out how best to go about the following problem.
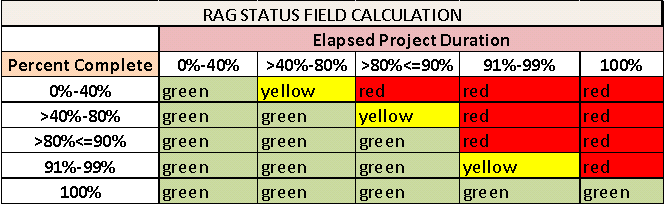
I have a list of projects which I want to calculate a project status on (red, amber, green) dependent on how far the project has elapsed, and how much of the project has completed.
I load the following:
SharedData:

LOAD distinct number as [Project Number],
       Date(Date#(mid([work_start],1,17),'DD-MMM-YYYY hh:mm'), 'DD-MM-YYYY') as [Project Actual Start Date],
     Date(Date#(mid([work_end],1,17),'DD-MMM-YYYY hh:mm'), 'DD-MM-YYYY') as [Project Actual End Date],
     percent_complete as [Percent Complete]

FROM
[..\
..\30_GLOBAL_SOURCES\QLIKVIEW - PROJECT TASK TTS.csv]
I then, in pseudo code, would like to do the following in order to find out the status of the project based on the table below - I think I would do this in the Load script:
TotalProjectDuration = [Project Actual End Date] - [Project Actual Start Date]
ElapsedTime = Today() - [Project Actual Start Date]
PercentageElapsed = ElapsedTime/TotalProjectDuration*100
Status = IF ( PercentageElapsed = 100% AND Percent complete <> 100%, RED... based on below
I would then like to join 'status' so I am left with one table with the following:
[Project Number]
[Project Actual End Date]
[Project Actual Start Date]
[Percent Complete]
[Status]
Would it be best to achieve this with a For loop after the Load statement to go through each row in resident SharedData? If so, could someone provide me with some rough syntax to help me achieve this?
Thanks,
Lizi
Accepted Solutions
- Mark as New
- Bookmark
- Subscribe
- Mute
- Subscribe to RSS Feed
- Permalink
- Report Inappropriate Content
Hi Lizi
For your calculated fields you can use preceding load like this:
SharedData:
LOAD *,
ElapsedTime/TotalProjectDuration*100 as PercentageElapsed
;
LOAD *,
DATE([Project Actual End Date] - [Project Actual Start Date]) as TotalProjectDuration ,
DATE(Today(1) - [Project Actual Start Date]) as ElapsedTime
;
LOAD distinct number as [Project Number],
Date(Date#(mid([work_start],1,17),'DD-MMM-YYYY hh:mm'), 'DD-MM-YYYY') as [Project Actual Start Date],
Date(Date#(mid([work_end],1,17),'DD-MMM-YYYY hh:mm'), 'DD-MM-YYYY') as [Project Actual End Date],
percent_complete as [Percent Complete]
FROM
[..\..\30_GLOBAL_SOURCES\QLIKVIEW - PROJECT TASK TTS.csv];
The colors can be defined at chart level with the background color property or also in the top level preceding load.
Please let me know if this helps.
Kind regards,