Unlock a world of possibilities! Login now and discover the exclusive benefits awaiting you.
- Qlik Community
- :
- All Forums
- :
- QlikView App Dev
- :
- Re: Variation of Crosstable
- Subscribe to RSS Feed
- Mark Topic as New
- Mark Topic as Read
- Float this Topic for Current User
- Bookmark
- Subscribe
- Mute
- Printer Friendly Page
- Mark as New
- Bookmark
- Subscribe
- Mute
- Subscribe to RSS Feed
- Permalink
- Report Inappropriate Content
Variation of Crosstable
Hi All,
I have a crosstable somewhat in different format than the normal as shown in below image:
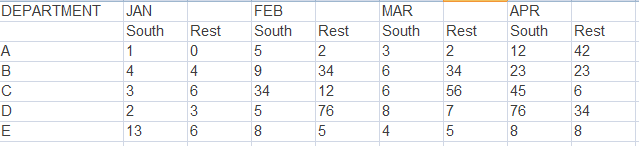
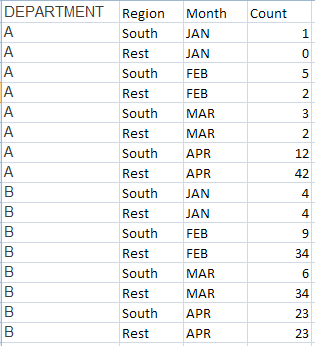
How do I Covert this table in the following form:
PFA application with sample data.
Thanks,
Abhijit
- Tags:
- cross_table
Accepted Solutions
- Mark as New
- Bookmark
- Subscribe
- Mute
- Subscribe to RSS Feed
- Permalink
- Report Inappropriate Content
Hi Abhijit,
Please find the attached file for the solution. In such case need to use the Enable Transformation step and CrossTbale methods while loading the data. Find the attached to get an idea.
Santhosh G
- Mark as New
- Bookmark
- Subscribe
- Mute
- Subscribe to RSS Feed
- Permalink
- Report Inappropriate Content
You should change your source data and load statement to generate the Region and Month dimensions. Region is now in your table as a measure.Therefore you cannot achieve the result your are looking for.
You need to load like this:
Load
Departement,
Region,
Month,
1 as counter
from ......xls
- Mark as New
- Bookmark
- Subscribe
- Mute
- Subscribe to RSS Feed
- Permalink
- Report Inappropriate Content
Thanks for your concern.
But changing the source structure needs to do bit of hardcoding in the script and would be a impracticle solution in my case.
I want to achieve it in QlikView transformation only.
- Mark as New
- Bookmark
- Subscribe
- Mute
- Subscribe to RSS Feed
- Permalink
- Report Inappropriate Content
Hi Abhijit,
Please find the attached file for the solution. In such case need to use the Enable Transformation step and CrossTbale methods while loading the data. Find the attached to get an idea.
Santhosh G
- Mark as New
- Bookmark
- Subscribe
- Mute
- Subscribe to RSS Feed
- Permalink
- Report Inappropriate Content
One more method with out hard coding, Find the attachment.
- Mark as New
- Bookmark
- Subscribe
- Mute
- Subscribe to RSS Feed
- Permalink
- Report Inappropriate Content
Hi,
Check this thread for solution.
multi_header_pivot_import.qvw
If it is a Static excel and doesn't contain any additional columns then just follow Santhosh Kumar script.
Regards.
Jagan.
- Mark as New
- Bookmark
- Subscribe
- Mute
- Subscribe to RSS Feed
- Permalink
- Report Inappropriate Content
perfect.. 🙂
thanks.