Unlock a world of possibilities! Login now and discover the exclusive benefits awaiting you.
- Qlik Community
- :
- All Forums
- :
- QlikView App Dev
- :
- Re: Vector charts
- Subscribe to RSS Feed
- Mark Topic as New
- Mark Topic as Read
- Float this Topic for Current User
- Bookmark
- Subscribe
- Mute
- Printer Friendly Page
- Mark as New
- Bookmark
- Subscribe
- Mute
- Subscribe to RSS Feed
- Permalink
- Report Inappropriate Content
Vector charts
Hi everybody,
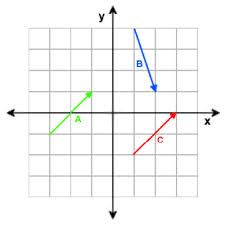
I want to display vectors in a chart. I got a start and an end point and now I want to show them as a kind of arrow like displayed in the attached file. Do you got an idea?
Thank you for helping.

Accepted Solutions
- Mark as New
- Bookmark
- Subscribe
- Mute
- Subscribe to RSS Feed
- Permalink
- Report Inappropriate Content
I solved it on my own. You can use a scatter chart. Your data has to look like this:
| Vector | Type | X | Y |
|---|---|---|---|
| A | Start | -3 | -1 |
| A | End | -1 | 1 |
| B | Start | 1 | 4 |
| B | End | 2 | 1 |
| C | Start | 1 | -2 |
| C | End | 0 | 3 |
As Dimension you need to choose Vector and then Type. Your expressions need to be sum(X) and sum(y). You can choose then show lines on the presentation tab.
- Mark as New
- Bookmark
- Subscribe
- Mute
- Subscribe to RSS Feed
- Permalink
- Report Inappropriate Content
I tried but not getting the picture you showed in the first. Interested to see that . Can you Post the sample qvw file?
- Mark as New
- Bookmark
- Subscribe
- Mute
- Subscribe to RSS Feed
- Permalink
- Report Inappropriate Content
This is for you ![]()