Unlock a world of possibilities! Login now and discover the exclusive benefits awaiting you.
- Qlik Community
- :
- All Forums
- :
- QlikView App Dev
- :
- Visual Cues for highest of 5 selections
- Subscribe to RSS Feed
- Mark Topic as New
- Mark Topic as Read
- Float this Topic for Current User
- Bookmark
- Subscribe
- Mute
- Printer Friendly Page
- Mark as New
- Bookmark
- Subscribe
- Mute
- Subscribe to RSS Feed
- Permalink
- Report Inappropriate Content
Visual Cues for highest of 5 selections
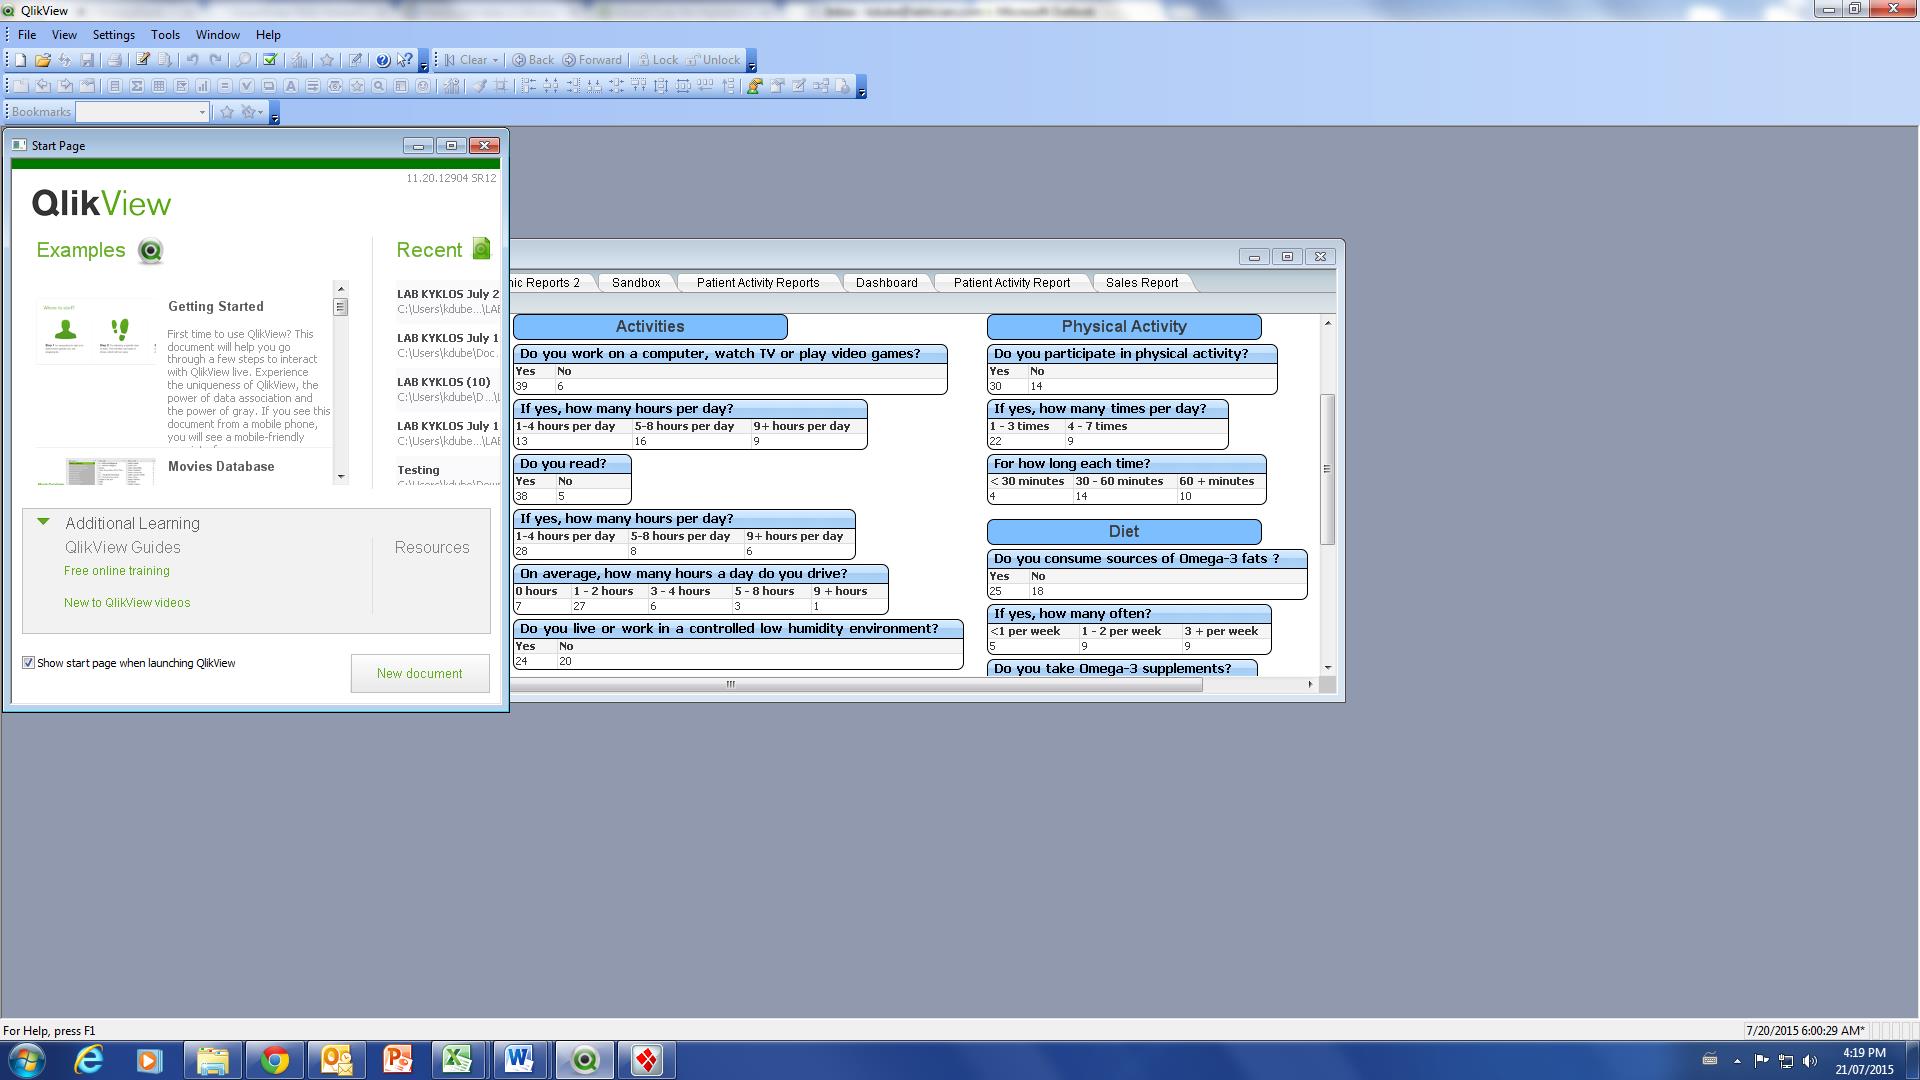
I am looking to add in visual ques so that when that data is presented, the highest number in a chart will be highlighted. For example, I currently have a straight table with the title "On average, how many hours a day do you drive?". I have columns that capture the date, they are; 0 hours, 1-2 hours, 2-4 hours, 5-8 hours and 9+ hours. Under each column title there is a number that represents that amount of people that answered the questionnaire. What I am trying to do is create a formula either in visual cues or elsewhere so that the column with the highest number will become highlighted when it is in fact the highest number.
I did this with questions that had only 2 columns by using visual cues and putting in the other columns formula into upper formula position. I was not able to do this with over 2 columns.
Thank for the help! Kyle
- Tags:
- visual ques
- Mark as New
- Bookmark
- Subscribe
- Mute
- Subscribe to RSS Feed
- Permalink
- Report Inappropriate Content
please post sample data/app
thanks
regards
Marco
- Mark as New
- Bookmark
- Subscribe
- Mute
- Subscribe to RSS Feed
- Permalink
- Report Inappropriate Content
i do not know how to ...
here is a screen shot. Please read my previous question.
- Mark as New
- Bookmark
- Subscribe
- Mute
- Subscribe to RSS Feed
- Permalink
- Report Inappropriate Content
Preparing examples for Upload - Reduction and Data Scrambling
in the forum editor select "use advanced editor" and "attach".
hope this helps
regards
Marco