Unlock a world of possibilities! Login now and discover the exclusive benefits awaiting you.
- Qlik Community
- :
- All Forums
- :
- QlikView App Dev
- :
- Re: Waterfall Chart With Dimensions?
- Subscribe to RSS Feed
- Mark Topic as New
- Mark Topic as Read
- Float this Topic for Current User
- Bookmark
- Subscribe
- Mute
- Printer Friendly Page
- Mark as New
- Bookmark
- Subscribe
- Mute
- Subscribe to RSS Feed
- Permalink
- Report Inappropriate Content
Waterfall Chart With Dimensions?
Hi all,
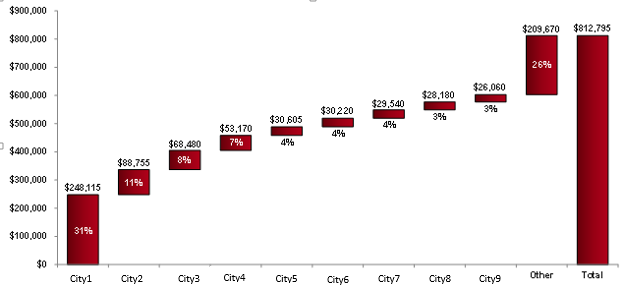
I'm trying to create a waterfall chart with, for example, spend by office. I'd like to have the dimension (office) be dynamic because I'm not sure how many cities the data will include when it is loaded into the document. The only waterfall examples I've seen are where the dimension is excluded and each expression acts as somewhat of an individual dimension. In that case, it's easy to choose an offset because you have more control of the surrounding expressions.
Is it possible to use a dimension when creating waterfall charts, and use a dynamic offset in relation to the other bars? Below is an example of the graphic I'd like to achieve.

- « Previous Replies
-
- 1
- 2
- Next Replies »
Accepted Solutions
- Mark as New
- Bookmark
- Subscribe
- Mute
- Subscribe to RSS Feed
- Permalink
- Report Inappropriate Content
Hi Paul,
Please check out the attached file. It might point you in the right direction.
Thanks
AJ
- Mark as New
- Bookmark
- Subscribe
- Mute
- Subscribe to RSS Feed
- Permalink
- Report Inappropriate Content
hope this helps.
- Mark as New
- Bookmark
- Subscribe
- Mute
- Subscribe to RSS Feed
- Permalink
- Report Inappropriate Content
Create a Bar Chart
Dimension : CITY
Expression : SUM(Value)
Click + sign of Expression and Select Bar Offset...
Type Below in Definition of Bar Offset
=Sum(Total Value) - Sum(Value)- RangeSum(Above(Sum(Value),1, RowNo()-1))
Hope this help...
- Mark as New
- Bookmark
- Subscribe
- Mute
- Subscribe to RSS Feed
- Permalink
- Report Inappropriate Content
Hi Paul,
Please check out the attached file. It might point you in the right direction.
Thanks
AJ
- Mark as New
- Bookmark
- Subscribe
- Mute
- Subscribe to RSS Feed
- Permalink
- Report Inappropriate Content
You guys are geniuses!
One more question - what if I want the offset on the "Total" bar to be zero? I tried something like:
If(rowno()=1 or RowNo() = max(RowNo()),0, [other expression])
but it didn't work.
- Mark as New
- Bookmark
- Subscribe
- Mute
- Subscribe to RSS Feed
- Permalink
- Report Inappropriate Content
And I also tried:
If(rowno()=1 or RowNo() = count(DISTINCT OfficeVariable),0, [other expression])
- Mark as New
- Bookmark
- Subscribe
- Mute
- Subscribe to RSS Feed
- Permalink
- Report Inappropriate Content
Please check out the attached.
Is this what you want.
- Mark as New
- Bookmark
- Subscribe
- Mute
- Subscribe to RSS Feed
- Permalink
- Report Inappropriate Content
This doesn't quite do it because the Total bar still has a non-zero offset. I want the offset on the Total bar to be zero, the same as the first row item.
- Mark as New
- Bookmark
- Subscribe
- Mute
- Subscribe to RSS Feed
- Permalink
- Report Inappropriate Content
Ahh, I got it:
If(rowno()=1 or rowno()-1 = count(DISTINCT Office),0, [expression])
- Mark as New
- Bookmark
- Subscribe
- Mute
- Subscribe to RSS Feed
- Permalink
- Report Inappropriate Content
Lol. It actually appears as if total has an offset but it doesn't. Its offset is zero same as the first one.
I have added axes to it. This will look better now.
- « Previous Replies
-
- 1
- 2
- Next Replies »