Unlock a world of possibilities! Login now and discover the exclusive benefits awaiting you.
- Qlik Community
- :
- All Forums
- :
- QlikView App Dev
- :
- Re: Waterfall Model in Qlikview
- Subscribe to RSS Feed
- Mark Topic as New
- Mark Topic as Read
- Float this Topic for Current User
- Bookmark
- Subscribe
- Mute
- Printer Friendly Page
- Mark as New
- Bookmark
- Subscribe
- Mute
- Subscribe to RSS Feed
- Permalink
- Report Inappropriate Content
Waterfall Model in Qlikview
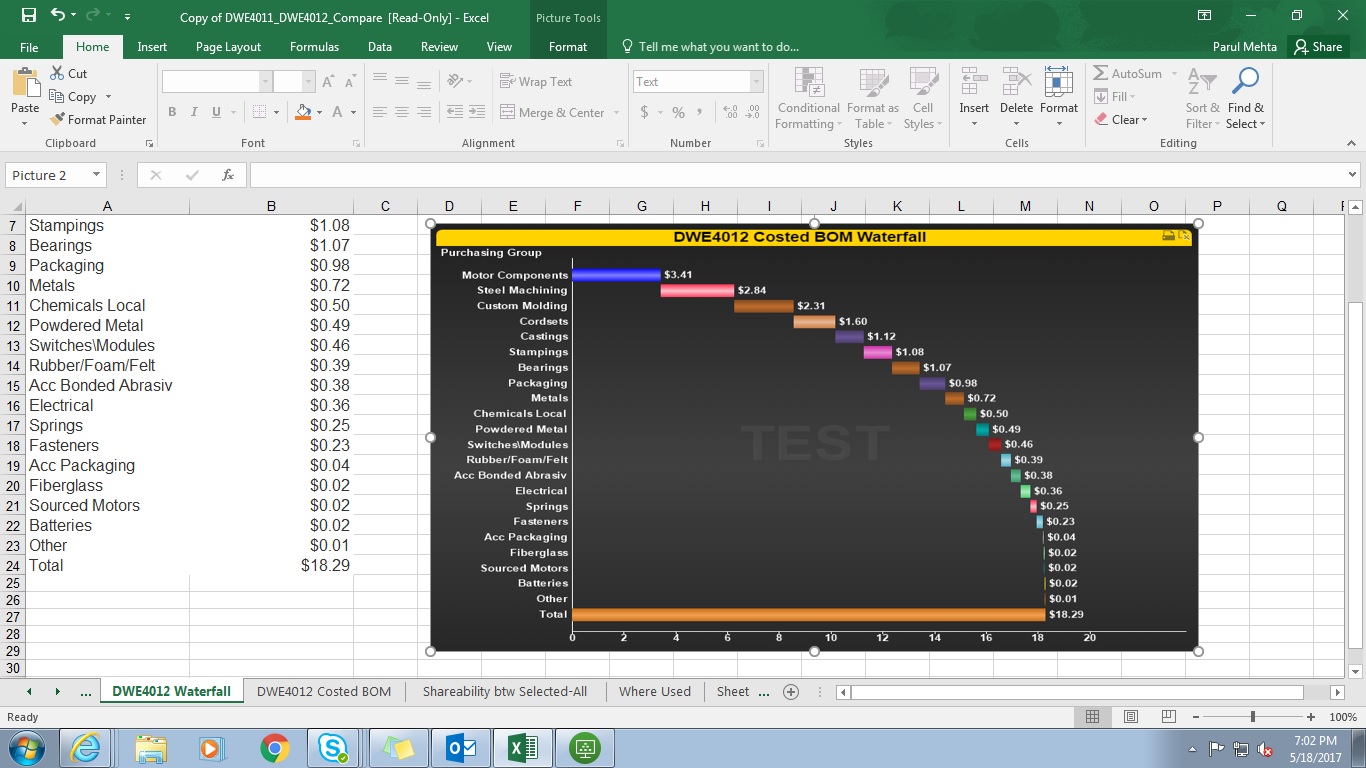
I require to create the waterfall chart in the attached screenshot, going from the highest until lowest value
Please provide inputs
- Mark as New
- Bookmark
- Subscribe
- Mute
- Subscribe to RSS Feed
- Permalink
- Report Inappropriate Content
- Mark as New
- Bookmark
- Subscribe
- Mute
- Subscribe to RSS Feed
- Permalink
- Report Inappropriate Content
Peter I require similar to the screenshot attached
- Mark as New
- Bookmark
- Subscribe
- Mute
- Subscribe to RSS Feed
- Permalink
- Report Inappropriate Content
What is different than in the above guide?
please find an example attached
Peter
- Mark as New
- Bookmark
- Subscribe
- Mute
- Subscribe to RSS Feed
- Permalink
- Report Inappropriate Content
1) The first bar is ending at 3, the next should start at 3 and not 0.
the second ends at 7, the third should start at 7
2) How to change the complete background color to black
3) How to display only upto 2 decimal places in values on data points in
- Mark as New
- Bookmark
- Subscribe
- Mute
- Subscribe to RSS Feed
- Permalink
- Report Inappropriate Content
why is the first bar ending at 3?
Have you read the above link?
Other settings from Numbers, Colours, Axes etc.
- Mark as New
- Bookmark
- Subscribe
- Mute
- Subscribe to RSS Feed
- Permalink
- Report Inappropriate Content
Hi Peter,
You want the exact chart, please send sample data and we will help.
- Mark as New
- Bookmark
- Subscribe
- Mute
- Subscribe to RSS Feed
- Permalink
- Report Inappropriate Content
Wilson,
PFA screenshot of the chart that I require.( Waterfall.jpg)
I have been able to create until this level ( Waterfal1.jpg)
Pending issues are:
Pending changes:
- Background color to be changed to black as in the sample shared.
- Value on data points to be changed to 2 decimals, expression to be kept at 0 decimals. ( currently both are getting picked as 2 decimals ) if I change the number format. I require 2 decimals for data points , and 0 deciamls for the x axis values as in waterfall.jpg
- Total expression to be added ( total is the sum of all values, and should start from 0 )
- Display $ value on data points only ( like in waterfall.jpg )
Data is stored in waterfall.xls, which needs to be displayed.
waterfall.qvw attached , which i have been able to create.
4 points mentioned above need to be implemented as well. ( Same as waterfall.jpg )