Unlock a world of possibilities! Login now and discover the exclusive benefits awaiting you.
- Qlik Community
- :
- All Forums
- :
- QlikView App Dev
- :
- Re: Waterfall chart using a stacked bar chart
- Subscribe to RSS Feed
- Mark Topic as New
- Mark Topic as Read
- Float this Topic for Current User
- Bookmark
- Subscribe
- Mute
- Printer Friendly Page
- Mark as New
- Bookmark
- Subscribe
- Mute
- Subscribe to RSS Feed
- Permalink
- Report Inappropriate Content
Waterfall chart using a stacked bar chart
Hi,
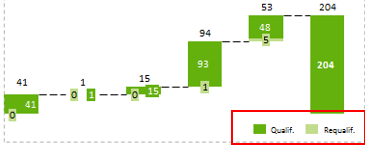
I need to build a waterfall chart using a stacked bar chart that shows me the evolution of two categories of sales of the last 5 months until the YTD for the qualified and requalified categories. The objective is to achieve a result like showed in the image below.
I’m trying to use the offset option with a stacked bar chart but I’m not getting any results. I have two expressions one for each category of sales and a offset expression based on something I read in Qlik Community.
I’m using as calculated dimension the following:
=Pick(Type, Month, 'Total')
The Type value is a table I have in load script:
Table:
LOAD * Inline [
Type
1
2
];
The formulas I’m using are:
=If(Pick(Type, Month, 'Total') = 'Total', Sum(total Value), Sum({$<CategoryType={'Qualified'}>} Value))
=If(Pick(Type, Month, 'Total') = 'Total', Sum(total Value), Sum({$<CategoryType={'Requalified'}>} Value))
The offset expression is:
=If(RowNo() = 1, 0, Sum(Total Value) - RangeSum(Above(If(Pick(Type, Month, 'Total') = 'Total', 0, Sum({$<CategoryType ={'Qualified'}>} Value)), 0, RowNo())))
Could anyone help me with this, please?
Thanks in advance
Regards
Paulo
- Mark as New
- Bookmark
- Subscribe
- Mute
- Subscribe to RSS Feed
- Permalink
- Report Inappropriate Content
Hi,
I'm using the expressions that you share in sample.
=Sum({$<TipoCandidatura={'Qualificação'}>}NrCandidaturasEntradas) * Avg({<Date = {"$(='>=' & Date(MonthStart(Max(Date), -4), 'DD-MM-YYYY') & '<=' & Date(Max(Date), 'DD-MM-YYYY'))"}>} 1)
and for the bar offset:
=If(Pick(Type, CategoryMonth, 'Total') = 'Total', 0,
RangeSum(Above(Sum({$<TipoCandidatura={'Qualificação', 'Requalificação'}>}NrCandidaturasEntradas), 1, RowNo())))
- Mark as New
- Bookmark
- Subscribe
- Mute
- Subscribe to RSS Feed
- Permalink
- Report Inappropriate Content
Hi sunny,
Based on the expressions from the last sample you share, I get the correct results, but the graph sow me all months ( Jan to Dec). The question now is how to show only the last 5 months.
Thanks
Paulo
- Mark as New
- Bookmark
- Subscribe
- Mute
- Subscribe to RSS Feed
- Permalink
- Report Inappropriate Content
I thought it was working? It stopped working again?
- Mark as New
- Bookmark
- Subscribe
- Mute
- Subscribe to RSS Feed
- Permalink
- Report Inappropriate Content
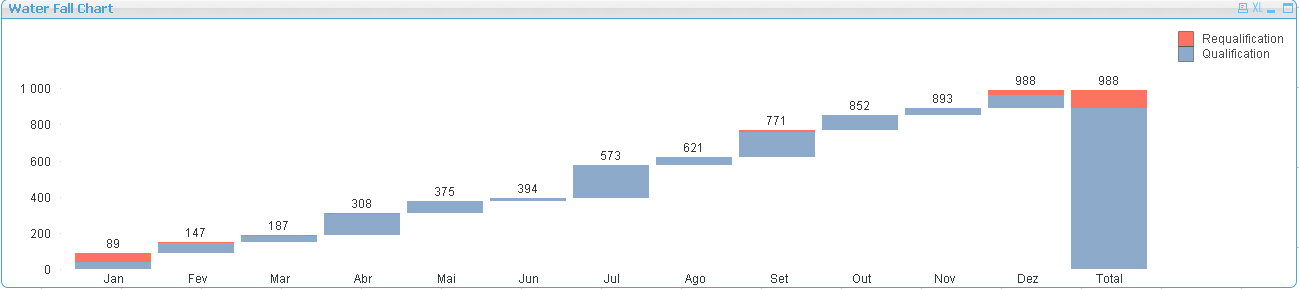
It works nice for all months. But I need to present only the last five months and its what is not working.
Please see a screenshot:
Any ideas what could be?
Thanks
Paulo
- Mark as New
- Bookmark
- Subscribe
- Mute
- Subscribe to RSS Feed
- Permalink
- Report Inappropriate Content
Multiplying with this -> Avg({<Date = {"$(='>=' & Date(MonthStart(Max(Date), -4), 'DD-MM-YYYY') & '<=' & Date(Max(Date), 'DD-MM-YYYY'))"}>} 1) did not help?
- Mark as New
- Bookmark
- Subscribe
- Mute
- Subscribe to RSS Feed
- Permalink
- Report Inappropriate Content
Hi Sunny,
I think now its working fine.
Many thanks
Regards
Paulo
- Mark as New
- Bookmark
- Subscribe
- Mute
- Subscribe to RSS Feed
- Permalink
- Report Inappropriate Content
What was the issue?
- Mark as New
- Bookmark
- Subscribe
- Mute
- Subscribe to RSS Feed
- Permalink
- Report Inappropriate Content
I have made a change on the calculated dimension to add the date format
=Pick(Type, date(SubcategoriaMonthYear,'MMM-yyyy'), 'Total')
and put a dimension limit to 6 to show me only the last months.
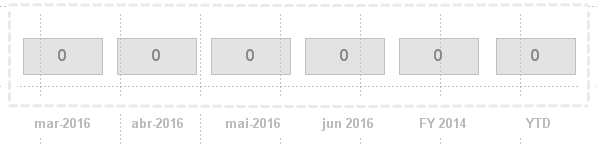
BTW Sunny, I have now an issue, following the same case, to get the totals for the last 5 months, but this time using Text Objects for the totals and Labels for the Month Year description. Something like showed in the image below:
How could be the best approach to do this? Can you help me?
Many thanks
Paulo
- Mark as New
- Bookmark
- Subscribe
- Mute
- Subscribe to RSS Feed
- Permalink
- Report Inappropriate Content
So can you clarify as to what exactly are you trying to do?
- Mark as New
- Bookmark
- Subscribe
- Mute
- Subscribe to RSS Feed
- Permalink
- Report Inappropriate Content
Imagine the same exercise that we did above using a waterfall chart, now to be done using Text objects that will present the totals for each month of the last 5 and the total for YTD. E.g:
Text box 1 will have the total for Month-5 and a label with the description "March 2016"
Text box 2 will have the total for Month-4 and a label with the description "April 2016"
Text box 3 will have the total for Month-3 and a label with the description "May 2016"
Text box 4 will have the total for Month-2 and a label with the description "June 2016"
Text box 5 will have the total for Month-1 and a label with the description "July 2016"
Text box 6 will have the total YTD and a label with the description "YTD 2016"
I'm doing the same exercise for "Years" and it works fine with the following expression (e.g. for Year-2):
=num(sum({Year = {$(=max(Year-2))}, Month = {"<=$(=max({<Year={$(=max(Year-2))}>} Month))"}>} Value))
But when I trying to change the expression for Months is not working.
Also using the other expression like the following is not working.
=Sum({<Date = {'>=$(=MonthStart(Max(Date), -2)) <= $(=MonthEnd(Max(Date), -2))'}>}Value)
You could use the sample that I sent you before to see the data.
Thanks
Regards
Paulo