Unlock a world of possibilities! Login now and discover the exclusive benefits awaiting you.
- Qlik Community
- :
- All Forums
- :
- QlikView App Dev
- :
- Weighted Average drill down from Year to Quarter
- Subscribe to RSS Feed
- Mark Topic as New
- Mark Topic as Read
- Float this Topic for Current User
- Bookmark
- Subscribe
- Mute
- Printer Friendly Page
- Mark as New
- Bookmark
- Subscribe
- Mute
- Subscribe to RSS Feed
- Permalink
- Report Inappropriate Content
Weighted Average drill down from Year to Quarter
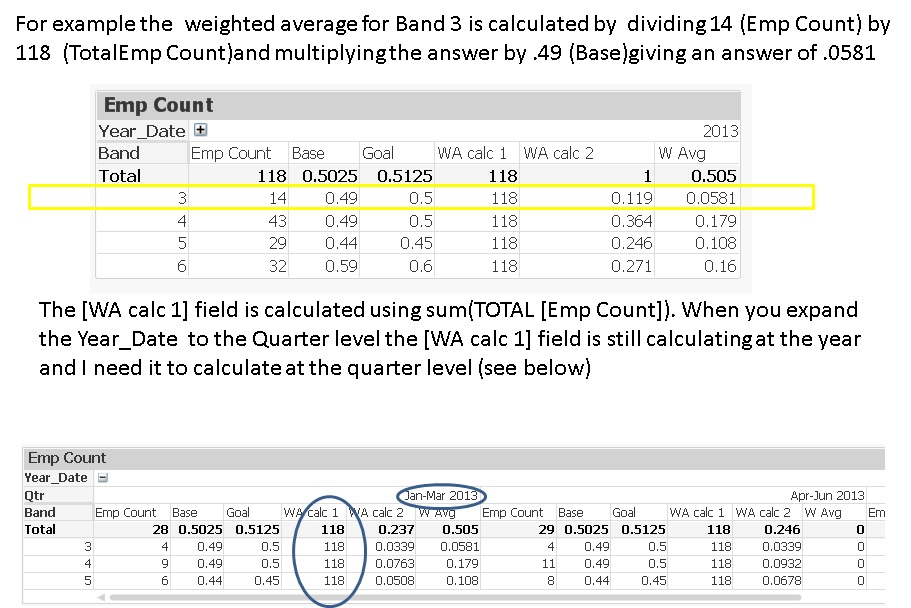
Can somebody please help with a requirement that I have to implement ‘weighted average’ – I can get this to work at the Year level but I can’t get the drill down to the Quarter level to work.
See screen shot and qvw attached

- Tags:
- weighted_average
- Mark as New
- Bookmark
- Subscribe
- Mute
- Subscribe to RSS Feed
- Permalink
- Report Inappropriate Content
perhaps
WA calc 1:
sum(TOTAL <Year_Date, Quarter_Date> [Emp Count])
- Mark as New
- Bookmark
- Subscribe
- Mute
- Subscribe to RSS Feed
- Permalink
- Report Inappropriate Content
Find the attachment 
- Mark as New
- Bookmark
- Subscribe
- Mute
- Subscribe to RSS Feed
- Permalink
- Report Inappropriate Content
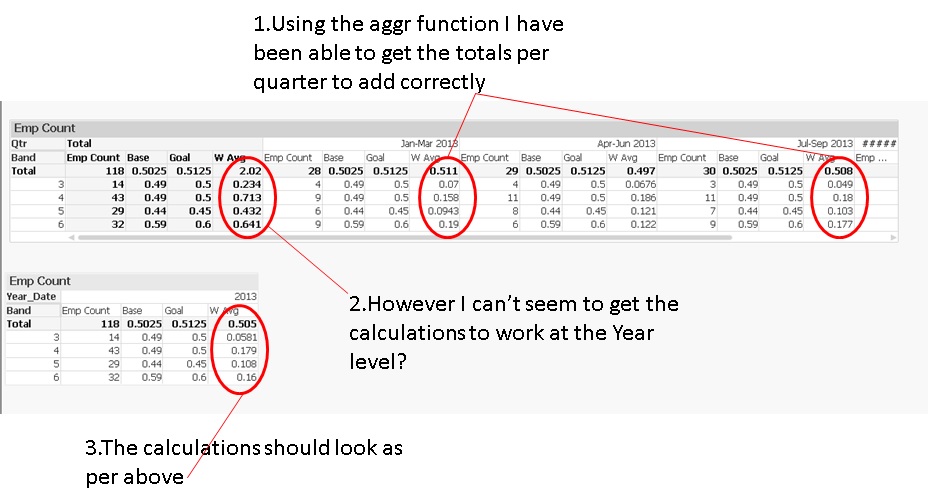
That has brought us a little bit closer but there is still a small issue which I am hoping that you can figure out:
- Mark as New
- Bookmark
- Subscribe
- Mute
- Subscribe to RSS Feed
- Permalink
- Report Inappropriate Content
Hi Haynes,
well your above Chart is aggregating with Band,Quarter_Date but your Second chart is aggregating with Band,Year_Date.
As your first Chart contain Quarter as Dimension so that chart will automatically get aggregated with Quarter.
Solution
1. for your out put I can suggest you to create a Chart with Brand as Dimension (Chart 2) and give Year and Quarter as selection.
2.if you see the output of first chart is also correct as per Qlikview Sum total which gives you 2.02 ,0.234..... but instead of sum you need sum total aggregated by Year so you need to create a Dynamic/Static Dimension with set analysis/valuelist () to obtain the same.
see examples for ValueList() in community