Unlock a world of possibilities! Login now and discover the exclusive benefits awaiting you.
- Qlik Community
- :
- All Forums
- :
- QlikView App Dev
- :
- Re: Which year has max sales
- Subscribe to RSS Feed
- Mark Topic as New
- Mark Topic as Read
- Float this Topic for Current User
- Bookmark
- Subscribe
- Mute
- Printer Friendly Page
- Mark as New
- Bookmark
- Subscribe
- Mute
- Subscribe to RSS Feed
- Permalink
- Report Inappropriate Content
Which year has max sales
Hi All,
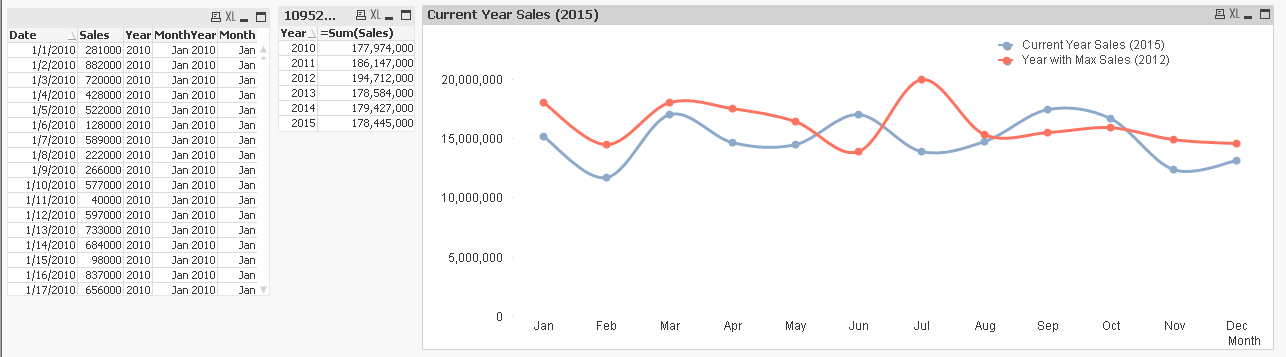
I have a line chart with month as dimension
i have monthly wise five year of data including current year.
requirement are:
1. One line as Current year sales data
2. And another line as year which has max sales.
Accepted Solutions
- Mark as New
- Bookmark
- Subscribe
- Mute
- Subscribe to RSS Feed
- Permalink
- Report Inappropriate Content
You can simplify the set expression a bit using Rank() function:
=Sum({<Year = {"=Rank(Sum(Sales))=1"}>}Sales)
And if the OP wants to find the year with max monthly sales:
=Sum({<Year = p({<MonthYear = {"=Rank(Sum(Sales))=1"}>}) >} Sales)
Attached the modified version of Sunny's sample
- Mark as New
- Bookmark
- Subscribe
- Mute
- Subscribe to RSS Feed
- Permalink
- Report Inappropriate Content
Max sales total on a given year or max sales on a month?
- Mark as New
- Bookmark
- Subscribe
- Mute
- Subscribe to RSS Feed
- Permalink
- Report Inappropriate Content
Looking for something like this?
- Mark as New
- Bookmark
- Subscribe
- Mute
- Subscribe to RSS Feed
- Permalink
- Report Inappropriate Content
You can simplify the set expression a bit using Rank() function:
=Sum({<Year = {"=Rank(Sum(Sales))=1"}>}Sales)
And if the OP wants to find the year with max monthly sales:
=Sum({<Year = p({<MonthYear = {"=Rank(Sum(Sales))=1"}>}) >} Sales)
Attached the modified version of Sunny's sample
- Mark as New
- Bookmark
- Subscribe
- Mute
- Subscribe to RSS Feed
- Permalink
- Report Inappropriate Content
Hi swuehl thank you so much ...:).
- Mark as New
- Bookmark
- Subscribe
- Mute
- Subscribe to RSS Feed
- Permalink
- Report Inappropriate Content
So what were you looking for? The first solution or the second one. Just curious 
- Mark as New
- Bookmark
- Subscribe
- Mute
- Subscribe to RSS Feed
- Permalink
- Report Inappropriate Content
actually i have used the expression given by SWUEHL .. i haven't open the example given by you... because i am using personal edition .
- Mark as New
- Bookmark
- Subscribe
- Mute
- Subscribe to RSS Feed
- Permalink
- Report Inappropriate Content