Unlock a world of possibilities! Login now and discover the exclusive benefits awaiting you.
- Qlik Community
- :
- All Forums
- :
- QlikView App Dev
- :
- Why it does not aggr(rangesum) after i filter
- Subscribe to RSS Feed
- Mark Topic as New
- Mark Topic as Read
- Float this Topic for Current User
- Bookmark
- Subscribe
- Mute
- Printer Friendly Page
- Mark as New
- Bookmark
- Subscribe
- Mute
- Subscribe to RSS Feed
- Permalink
- Report Inappropriate Content
Why it does not aggr(rangesum) after i filter
Edit1: I already upload the qvf file... for reference thanks..
Edit2: I update my formula
from: "((Aggr(RangeSum(Above(Sum({<GL2= {11}>} GLTOTAL), 0, RowNo())), BRANCHNAME, [DOCDATE.autoCalendar.Month])) ) - ((Aggr(RangeSum(Above(Sum({<GL2= {21}>} GLTOTAL), 0, RowNo())), BRANCHNAME, [DOCDATE.autoCalendar.Month])) *-1 )"
into:
from: "((Aggr(RangeSum(Above(Sum({<GL2= {11},[DOCDATE.autoCalendar.Month]=>} GLTOTAL), 0, RowNo())), BRANCHNAME, [DOCDATE.autoCalendar.Month])) ) - ((Aggr(RangeSum(Above(Sum({<GL2= {21},[DOCDATE.autoCalendar.Month]=>} GLTOTAL), 0, RowNo())), BRANCHNAME, [DOCDATE.autoCalendar.Month])) *-1 )"
Hi good day every one i just created a financial KPI last week with the help of some people here in our community and it was good... but after i check every details of it i notice that there is something went wrong after i filter...
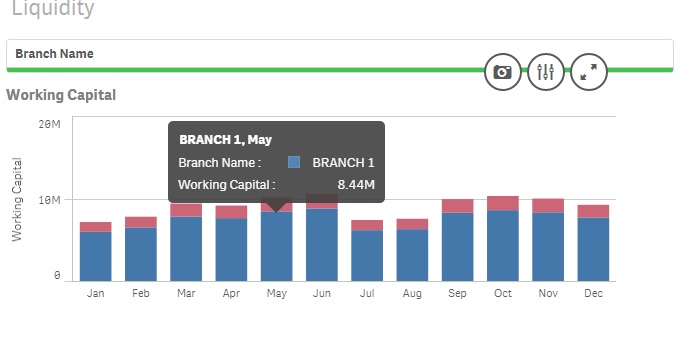
the 1st chart is perfect the figure shows exactly what i want..
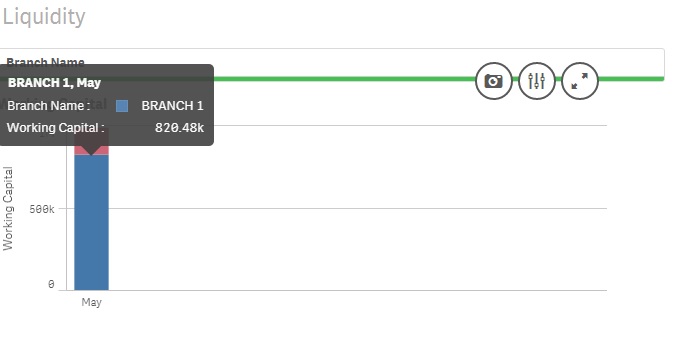
but after i filter a month everything went wrong...
ohh by the way this is my formula
"((Aggr(RangeSum(Above(Sum({<GL2= {11}>} GLTOTAL), 0, RowNo())), BRANCHNAME, [DOCDATE.autoCalendar.Month])) ) - ((Aggr(RangeSum(Above(Sum({<GL2= {21}>} GLTOTAL), 0, RowNo())), BRANCHNAME, [DOCDATE.autoCalendar.Month])) *-1 )"
can some one have any idea why it happens?
thanks
Message was edited by: Reynaldson Aceberos QVF file is added
- « Previous Replies
-
- 1
- 2
- Next Replies »
Accepted Solutions
- Mark as New
- Bookmark
- Subscribe
- Mute
- Subscribe to RSS Feed
- Permalink
- Report Inappropriate Content
i update my formula into
'=Aggr(RangeSum(Above(Sum({<GLHeader= {1}, [DOCDATE.autoCalendar.Month]=>} GLTOTAL), 0, RowNo())), Branch, Month)' and now even if i select any month it will not take any effects on figures...
thanks alot mate for helping me... 
-rey
- Mark as New
- Bookmark
- Subscribe
- Mute
- Subscribe to RSS Feed
- Permalink
- Report Inappropriate Content
May be you did one filter extra from selector? If All fine, May be round up with Sum(Aggr(..))
- Mark as New
- Bookmark
- Subscribe
- Mute
- Subscribe to RSS Feed
- Permalink
- Report Inappropriate Content
thanks for that quick reply
i got no luck mate i try to wrap my formula with sum()
sum(((Aggr(RangeSum(Above(Sum({<GL2= {11}>} GLTOTAL), 0, RowNo())), BRANCHNAME, [DOCDATE.autoCalendar.Month])) ) - ((Aggr(RangeSum(Above(Sum({<GL2= {21}>} GLTOTAL), 0, RowNo())), BRANCHNAME, [DOCDATE.autoCalendar.Month])) *-1 )) but still same result
- Mark as New
- Bookmark
- Subscribe
- Mute
- Subscribe to RSS Feed
- Permalink
- Report Inappropriate Content
Equation should cover all elements like
(Sum(Aggr(RangeSum(Above(Sum({<GL2= {11}>} GLTOTAL), 0, RowNo())), BRANCHNAME, [DOCDATE.autoCalendar.Month])) - Sum(Aggr(RangeSum(Above(Sum({<GL2= {21}>} GLTOTAL), 0, RowNo())), BRANCHNAME, [DOCDATE.autoCalendar.Month])) *-1)
- Mark as New
- Bookmark
- Subscribe
- Mute
- Subscribe to RSS Feed
- Permalink
- Report Inappropriate Content
Hi,
Maybe the problem is the Above function (along with RowNo) as it may lose its meaning after the selection.
You may want to convert this chart to a table for review and also share the unaggregated data for troubleshooting?
Cheers,
Luis
- Mark as New
- Bookmark
- Subscribe
- Mute
- Subscribe to RSS Feed
- Permalink
- Report Inappropriate Content
thanks mate
well i use same concept on total asset and i dont have any problem on it...
Aggr(RangeSum(Above(Sum({<GLHeader= {1}>} GLTOTAL), 0, RowNo())), BRANCHNAME, [DOCDATE.autoCalendar.Month])
then i use the same concept on getting for the working capital but i dont get what i expected result
(Sum(Aggr(RangeSum(Above(Sum({<GL2= {11}>} GLTOTAL), 0, RowNo())), BRANCHNAME, [DOCDATE.autoCalendar.Month])) - Sum(Aggr(RangeSum(Above(Sum({<GL2= {21}>} GLTOTAL), 0, RowNo())), BRANCHNAME, [DOCDATE.autoCalendar.Month])) *-1)
wait ill upload my qvf file
im looking where to attached it...
thanks
- Mark as New
- Bookmark
- Subscribe
- Mute
- Subscribe to RSS Feed
- Permalink
- Report Inappropriate Content
My assumption may match in your rek, Perhaps this?
(Sum(Aggr(RangeSum(Above(TOTAL Sum({<GL2= {11}>} GLTOTAL), 0, RowNo())), BRANCHNAME, [DOCDATE.autoCalendar.Month])) - Sum(Aggr(RangeSum(Above(TOTAL Sum({<GL2= {21}>} GLTOTAL), 0, RowNo())), BRANCHNAME, [DOCDATE.autoCalendar.Month])) *-1)
- Mark as New
- Bookmark
- Subscribe
- Mute
- Subscribe to RSS Feed
- Permalink
- Report Inappropriate Content
Hi, you may not be able to upload it on this post, as it seems you can attach documents only when the post is created. I hope they fix that.....
If you want, send it via email
Cheers
Luis
- Mark as New
- Bookmark
- Subscribe
- Mute
- Subscribe to RSS Feed
- Permalink
- Report Inappropriate Content
it takes me time to find it..
but i manage.. i edit my thread and upload the qvf..
thank you very much mate..
- Mark as New
- Bookmark
- Subscribe
- Mute
- Subscribe to RSS Feed
- Permalink
- Report Inappropriate Content
Total Assets also fails after selection.... I mean changes its value
I'll take a look,
Luis
- « Previous Replies
-
- 1
- 2
- Next Replies »