Unlock a world of possibilities! Login now and discover the exclusive benefits awaiting you.
- Qlik Community
- :
- All Forums
- :
- QlikView App Dev
- :
- Working with ranges on Income Statement
- Subscribe to RSS Feed
- Mark Topic as New
- Mark Topic as Read
- Float this Topic for Current User
- Bookmark
- Subscribe
- Mute
- Printer Friendly Page
- Mark as New
- Bookmark
- Subscribe
- Mute
- Subscribe to RSS Feed
- Permalink
- Report Inappropriate Content
Working with ranges on Income Statement
Hi all,
Working with ranges like accounts seem to be a bit tricky. Anyway, I'm trying to build Income Statement with a lot of account ranges and dimensions. My data model is a bit complex based on Fact and Dimensions but I am simplifying the model in this table:
| AccountNO | Amount | Dimension | Year |
|---|---|---|---|
| 1 | 100 | 1 | 2014 |
| 2 | 100 | 2 | 2014 |
| 3 | 100 | 3 | 2014 |
| 4 | 100 | 1 | 2014 |
| 5 | 100 | 2 | 2014 |
| 6 | 100 | 3 | 2014 |
| 7 | 100 | 1 | 2014 |
| 8 | 100 | 2 | 2014 |
| 9 | 100 | 3 | 2014 |
| 10 | 100 | 1 | 2014 |
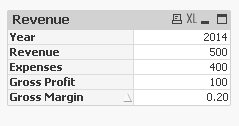
So let's say I want to calculate the following and show them in one straight table:
1. Revenue: Range AccountNo (1 to 😎 AND Dimension between (2 to 3)
2. Expenses: Range AccountNo (5 to 10) AND Dimension between (1 and 2)
3. Gross Profit = Revenue - Expenses
4. Gross Margin = Gross Profit / Revenue
So the output should be something like this:
| Title | Amount | Year |
|---|---|---|
| Revenue | 400 | 2014 |
| Expenses | 300 | 2014 |
| Gross Profit | 100 | 2014 |
| Gross Margin | 0.25 | 2014 |
I'm not looking for a complete solution, just any tip/advice on what could the best way to load and handle the above logic would be appreciated.
Thanks.
Accepted Solutions
- Mark as New
- Bookmark
- Subscribe
- Mute
- Subscribe to RSS Feed
- Permalink
- Report Inappropriate Content
Take a look at the another way
- Mark as New
- Bookmark
- Subscribe
- Mute
- Subscribe to RSS Feed
- Permalink
- Report Inappropriate Content
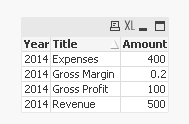
Seems like I get a slightly different number for Revenue and Expense based on the logic you gave and the conditions:
UPDATE IMAGE
But check it out and see if this helps.
- Mark as New
- Bookmark
- Subscribe
- Mute
- Subscribe to RSS Feed
- Permalink
- Report Inappropriate Content
Thanks Sunny. Just because the real scenario is a bit more complex and involves a wide set of records which will impact the performance in case the logic was in the set analysis. So could that processing handled via scripts during the ETL?
- Mark as New
- Bookmark
- Subscribe
- Mute
- Subscribe to RSS Feed
- Permalink
- Report Inappropriate Content
Take a look at the another way
- Mark as New
- Bookmark
- Subscribe
- Mute
- Subscribe to RSS Feed
- Permalink
- Report Inappropriate Content
It's another good solution in case I want handle the logic at the user's tier (set analysis) Thanks Kush. However as I mentioned above I'm looking to handle the logic in the loading script.
Thanks again.
- Mark as New
- Bookmark
- Subscribe
- Mute
- Subscribe to RSS Feed
- Permalink
- Report Inappropriate Content
This?
Script:
Table:
LOAD AccountNO,
Amount,
Dimension,
Year
FROM
[https://community.qlik.com/thread/174540]
(html, codepage is 1252, embedded labels, table is @1);
Temp:
LOAD Sum(Amount) as Amount,
'Revenue' as Title,
Year
Resident Table
Where AccountNO >= 1 and AccountNO <= 8 and Dimension >=2 and Dimension <=3
Group By Year;
Concatenate(Temp)
LOAD Sum(Amount) as Amount,
'Expenses' as Title,
Year
Resident Table
Where AccountNO >= 5 and AccountNO <= 10 and Dimension >=1 and Dimension <=2
Group By Year;
Concatenate(Temp)
LOAD Sum(If(AccountNO >= 1 and AccountNO <= 8 and Dimension >=2 and Dimension <=3, Amount))-
Sum(If(AccountNO >= 5 and AccountNO <= 10 and Dimension >=1 and Dimension <=2, Amount)) as Amount,
'Gross Profit' as Title,
Year
Resident Table
Where AccountNO >= 1 and AccountNO <= 10 and Dimension >=1 and Dimension <=3
Group By Year;
Concatenate(Temp)
LOAD (Sum(If(AccountNO >= 1 and AccountNO <= 8 and Dimension >=2 and Dimension <=3, Amount))-
Sum(If(AccountNO >= 5 and AccountNO <= 10 and Dimension >=1 and Dimension <=2, Amount)))/
Sum(If(AccountNO >= 1 and AccountNO <= 8 and Dimension >=2 and Dimension <=3, Amount)) as Amount,
'Gross Margin' as Title,
Year
Resident Table
Where AccountNO >= 1 and AccountNO <= 10 and Dimension >=1 and Dimension <=3
Group By Year;
DROP Table Table;
- Mark as New
- Bookmark
- Subscribe
- Mute
- Subscribe to RSS Feed
- Permalink
- Report Inappropriate Content
ok so here is the script
Table:
LOAD * Inline [
AccountNO, Amount, Dimension, Year
1, 100, 1, 2014
2, 100, 2, 2014
3, 100, 3, 2014
4, 100, 1, 2014
5, 100, 2, 2014
6, 100, 3, 2014
7, 100, 1, 2014
8, 100, 2, 2014
9, 100, 3, 2014
10, 100, 1, 2014 ];
Data:
LOAD sum(if((AccountNO>=1 and AccountNO<=8) and (Dimension>=2 and Dimension<=3) ,Amount)) as AMT,
Year ,
'Revenue' as Title
Resident Table
Group By Year;
Concatenate
LOAD sum(if((AccountNO>=5 and AccountNO<=10) and (Dimension>=1 and Dimension<=2) ,Amount)) as AMT,
Year ,
'Expenses' as Title
Resident Table
Group By Year;
Concatenate
LOAD sum(if(Title='Revenue', AMT)) - sum(if(Title='Expenses', AMT)) as AMT,
Year,
'Gross Profit' as Title
Resident Data
Group by Year;
Concatenate
LOAD sum(if(Title='Gross Profit', AMT))/sum(if(Title='Revenue', AMT)) as AMT,
Year,
'Gross Margine' as Title
Resident Data
Group by Year;
- Mark as New
- Bookmark
- Subscribe
- Mute
- Subscribe to RSS Feed
- Permalink
- Report Inappropriate Content
Thank you guys, you are the best!
- Mark as New
- Bookmark
- Subscribe
- Mute
- Subscribe to RSS Feed
- Permalink
- Report Inappropriate Content
LouieERI we are always happy to help