Unlock a world of possibilities! Login now and discover the exclusive benefits awaiting you.
- Qlik Community
- :
- All Forums
- :
- QlikView App Dev
- :
- Re: YTD Analysis
- Subscribe to RSS Feed
- Mark Topic as New
- Mark Topic as Read
- Float this Topic for Current User
- Bookmark
- Subscribe
- Mute
- Printer Friendly Page
- Mark as New
- Bookmark
- Subscribe
- Mute
- Subscribe to RSS Feed
- Permalink
- Report Inappropriate Content
YTD Analysis
Hi,
I have data for two years and i want to display the result in a particular format. I have all the formulas and values are ready with me and needs the help from you to display the data in the format as per requirement.
attached the file which I have and the format which I need to show the output.
Attached is the Screenshots of the Input and output values
Thanks in Advance
Accepted Solutions
- Mark as New
- Bookmark
- Subscribe
- Mute
- Subscribe to RSS Feed
- Permalink
- Report Inappropriate Content
- Mark as New
- Bookmark
- Subscribe
- Mute
- Subscribe to RSS Feed
- Permalink
- Report Inappropriate Content
Can you attach sample file?
- Mark as New
- Bookmark
- Subscribe
- Mute
- Subscribe to RSS Feed
- Permalink
- Report Inappropriate Content
Hi Celamb,
Thanks for ur quick reply.
Updated the question with input excel.
Regards
- Mark as New
- Bookmark
- Subscribe
- Mute
- Subscribe to RSS Feed
- Permalink
- Report Inappropriate Content
You can create a Year to Date field in your calendar that will flag dates in previous years up to today. It would look something like this in your script:
If(InYearToDate(Date, $(vTodaysDate), 0)
or InYearToDate(Date, $(vTodaysDate), -1)
or InYearToDate(Date, $(vTodaysDate), -2)
or InYearToDate(Date, $(vTodaysDate), -3)
or InYearToDate(Date, $(vTodaysDate), -4)
, 'YTD') as YTD,
- Mark as New
- Bookmark
- Subscribe
- Mute
- Subscribe to RSS Feed
- Permalink
- Report Inappropriate Content
See attached qvw.
talk is cheap, supply exceeds demand
- Mark as New
- Bookmark
- Subscribe
- Mute
- Subscribe to RSS Feed
- Permalink
- Report Inappropriate Content
Am using QlikView P E 
- Mark as New
- Bookmark
- Subscribe
- Mute
- Subscribe to RSS Feed
- Permalink
- Report Inappropriate Content
This is the script:
CrossTable(Year,Amount,2)
LOAD subfield(Year,'_',1) as KPI, SubField(Year,'_',-1) as Period,
[2013],
[2012]
FROM Input_YTD.xls (biff, embedded labels, table is [Sheet1$]);
And the pivot table looks like this:
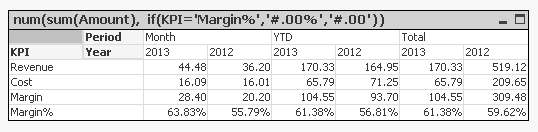
You can see the only expression of the pivot table in the caption. The dimensions Period and Year have been dragged to above the expression so they show horizontally.
talk is cheap, supply exceeds demand