Unlock a world of possibilities! Login now and discover the exclusive benefits awaiting you.
- Qlik Community
- :
- All Forums
- :
- QlikView App Dev
- :
- YTD KPI presentation
- Subscribe to RSS Feed
- Mark Topic as New
- Mark Topic as Read
- Float this Topic for Current User
- Bookmark
- Subscribe
- Mute
- Printer Friendly Page
- Mark as New
- Bookmark
- Subscribe
- Mute
- Subscribe to RSS Feed
- Permalink
- Report Inappropriate Content
YTD KPI presentation
I need to recreate an existing report that has several KPIs (eight of them) that are presented twice on a dashboard - once for the selected period (usually the previous week or month) and then the YTD figure for up to the last date selected in the other KPI.
For instance –
Select Year, Month, and (possibly) days and get
Total Cancelled: 4
YTD Total Cancelled: 12
All of the blocks are dimensionless single expression straight tables. I'm using a "standard" Master Calendar, so have "CurYTDFlag", but I can't figure out how to use it in this context.
The formula for the Total Cancelled (straight table) is something like (expression):
=sum(if(Outcome = 'Cnx' or Outcome = 'DC',1,0))
Other KPIs have expressions something like:
=count(Outcome)
Other KPIs have expressions something like:
=count(Outcome)
One is slightly more complicated (gives a percentage):
(count(ActualTime)-Sum(Delay))/Count(ActualTime)
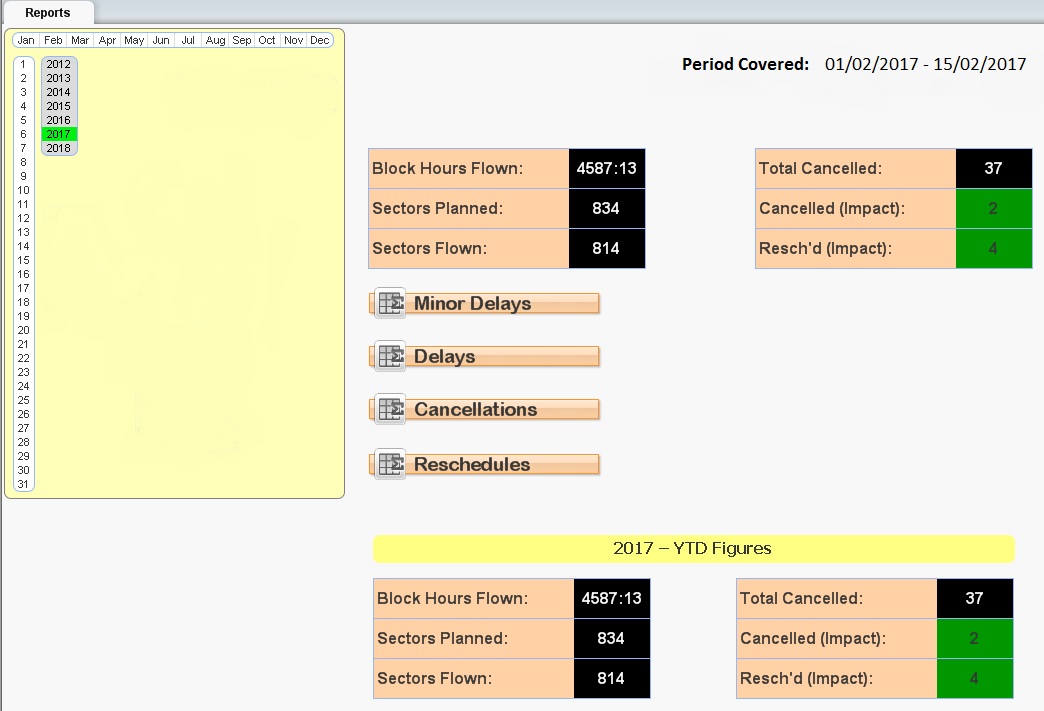
What should the expressions be to show the figures from 01/01/2017 to 15/02/2017 in the bottom boxes now matter what is selected in the dates?
Thank you for your attention!
Accepted Solutions
- Mark as New
- Bookmark
- Subscribe
- Mute
- Subscribe to RSS Feed
- Permalink
- Report Inappropriate Content
Hahahaha yes... my bad that I did not point that out
- Mark as New
- Bookmark
- Subscribe
- Mute
- Subscribe to RSS Feed
- Permalink
- Report Inappropriate Content
May be this
=Count({<Outcome = {'Cnx', 'DC'}, CurYTDFlag = {1}, Year, Month, MonthYear, Quarter, Date>} Outcome)
I have used some date time related fields where you might make selections, bu the idea is to replace these with those fields where the users might possibly make selections.
- Mark as New
- Bookmark
- Subscribe
- Mute
- Subscribe to RSS Feed
- Permalink
- Report Inappropriate Content
Thank you Sunny! That's working for one of them. I'll try it for the others and let you know.
Count({<Outcome={'Cnx,'DC'},CurYTDFlag={1},Month>}Outcome)
- Mark as New
- Bookmark
- Subscribe
- Mute
- Subscribe to RSS Feed
- Permalink
- Report Inappropriate Content
Sounds good 
- Mark as New
- Bookmark
- Subscribe
- Mute
- Subscribe to RSS Feed
- Permalink
- Report Inappropriate Content
Sunny, Thank you for your help...sooooo close now.
I've got that working for all of the KPS now.
However... (sorry)...it gives me the total for the YT today...I'd like it to show the YT the end of the dates selected.
For instance, if I have Feb and 2017 selected I'd like to see the figures for 1/1/17 through 28/2/17.
- Mark as New
- Bookmark
- Subscribe
- Mute
- Subscribe to RSS Feed
- Permalink
- Report Inappropriate Content
May be like this:
Count({<Outcome={'Cnx,'DC'},CurYTDFlag={1}, Month, Date = {"$(='<=' & Date(Max(Date), 'D/M/YY'))"}>}Outcome)
Use the date field format that you have.....
- Mark as New
- Bookmark
- Subscribe
- Mute
- Subscribe to RSS Feed
- Permalink
- Report Inappropriate Content
hm...that one's giving me "Errors in expression". Is one of the 'Date's in the new bit my actual date field?
- Mark as New
- Bookmark
- Subscribe
- Mute
- Subscribe to RSS Feed
- Permalink
- Report Inappropriate Content
YES!!! it is. if I change the 'Date' to my actual date field name it looks like it works.
- Mark as New
- Bookmark
- Subscribe
- Mute
- Subscribe to RSS Feed
- Permalink
- Report Inappropriate Content
Hahahaha yes... my bad that I did not point that out
- Mark as New
- Bookmark
- Subscribe
- Mute
- Subscribe to RSS Feed
- Permalink
- Report Inappropriate Content
So...
Count({<Outcome={'DC','Cnx'},CurYTDFlag={1},Month, ScheduledDate={"$(='<=' & Date(Max(ScheduledDate), 'DD/MM/YY'))"}>}Outcome)
works. It says Errors in the Edit Expression window but it works on the sheet.
Thank you Sunny!