Unlock a world of possibilities! Login now and discover the exclusive benefits awaiting you.
- Qlik Community
- :
- All Forums
- :
- QlikView App Dev
- :
- Re: Year and Month Axis in Charts
- Subscribe to RSS Feed
- Mark Topic as New
- Mark Topic as Read
- Float this Topic for Current User
- Bookmark
- Subscribe
- Mute
- Printer Friendly Page
- Mark as New
- Bookmark
- Subscribe
- Mute
- Subscribe to RSS Feed
- Permalink
- Report Inappropriate Content
Year and Month Axis in Charts
Hi all ,
i have a dimension Year & '-' & Month used in the axis of a bar chart.
its displayed as shown below .. 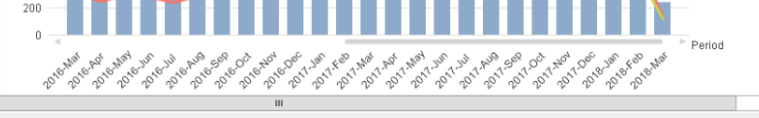
now i dont want to show years repetitively.. instead have one common label 2016 under those months which belong to 2016.
like wise for all years.
Kinldy help
Thanks
- Mark as New
- Bookmark
- Subscribe
- Mute
- Subscribe to RSS Feed
- Permalink
- Report Inappropriate Content
Why dont you use MonthYear as Dim
It will show like this
Jan-16,Feb-16,Mar-16.... and so on
which is better than showing the whole Year and Month
- Mark as New
- Bookmark
- Subscribe
- Mute
- Subscribe to RSS Feed
- Permalink
- Report Inappropriate Content
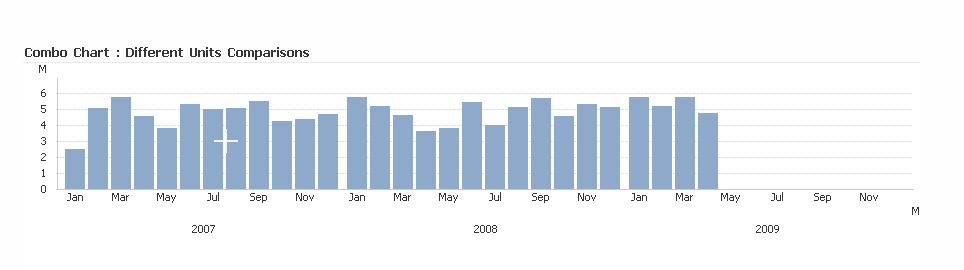
this chart has 2 dimensions, year and month and 2 expression, the second expression is invisible
- Mark as New
- Bookmark
- Subscribe
- Mute
- Subscribe to RSS Feed
- Permalink
- Report Inappropriate Content
Hi Massimo,
Thanks for your reply , this works , but there are empty months coming up even when there is no data.
I tried checking Suppress null values option , but it doesn't work.
kindly suggest on what can be done in this situation.
Thanks
- Mark as New
- Bookmark
- Subscribe
- Mute
- Subscribe to RSS Feed
- Permalink
- Report Inappropriate Content
Make sure "Show All Values" is deselected in the Dimension tab
- Mark as New
- Bookmark
- Subscribe
- Mute
- Subscribe to RSS Feed
- Permalink
- Report Inappropriate Content
Hi Sudhir ,
The "Show All Values" is deselected in the Dimension tab , but seems like it doesn't work.
Have you tried ?
Thanks