Unlock a world of possibilities! Login now and discover the exclusive benefits awaiting you.
- Qlik Community
- :
- All Forums
- :
- QlikView App Dev
- :
- Year and quarter data representation in a bar char...
- Subscribe to RSS Feed
- Mark Topic as New
- Mark Topic as Read
- Float this Topic for Current User
- Bookmark
- Subscribe
- Mute
- Printer Friendly Page
- Mark as New
- Bookmark
- Subscribe
- Mute
- Subscribe to RSS Feed
- Permalink
- Report Inappropriate Content
Year and quarter data representation in a bar chart
Hi Community,
I need to represent a last 12 months data and last 3 months data in a same bar chart.
can any one help to solve the issue please
Thanks in advance,
Regards,
Chinnu.
- Tags:
- new_to_qlikview
- Mark as New
- Bookmark
- Subscribe
- Mute
- Subscribe to RSS Feed
- Permalink
- Report Inappropriate Content
Not sure why you can use what I mentioned above???
Count({<DateField = {"$(='>=' & Date(AddMonths(Max(DateField), -12), 'YourDateFieldFormat') & '<=' & Date(Max(DateField), 'YourDateFieldFormat'))"}>} [Incident ID])
- Mark as New
- Bookmark
- Subscribe
- Mute
- Subscribe to RSS Feed
- Permalink
- Report Inappropriate Content
Sunny, The above expression is not working
- Mark as New
- Bookmark
- Subscribe
- Mute
- Subscribe to RSS Feed
- Permalink
- Report Inappropriate Content
Sunny can you please help me i will attach my sample data file ....
Thanks in advance,
Chinnu.
- Mark as New
- Bookmark
- Subscribe
- Mute
- Subscribe to RSS Feed
- Permalink
- Report Inappropriate Content
Sure
- Mark as New
- Bookmark
- Subscribe
- Mute
- Subscribe to RSS Feed
- Permalink
- Report Inappropriate Content
Sunny I am attaching sample data
I need to display bar chart based on count of incidents for the past 12 and past 3 months respective to the group.
Thanks in advance
- Mark as New
- Bookmark
- Subscribe
- Mute
- Subscribe to RSS Feed
- Permalink
- Report Inappropriate Content
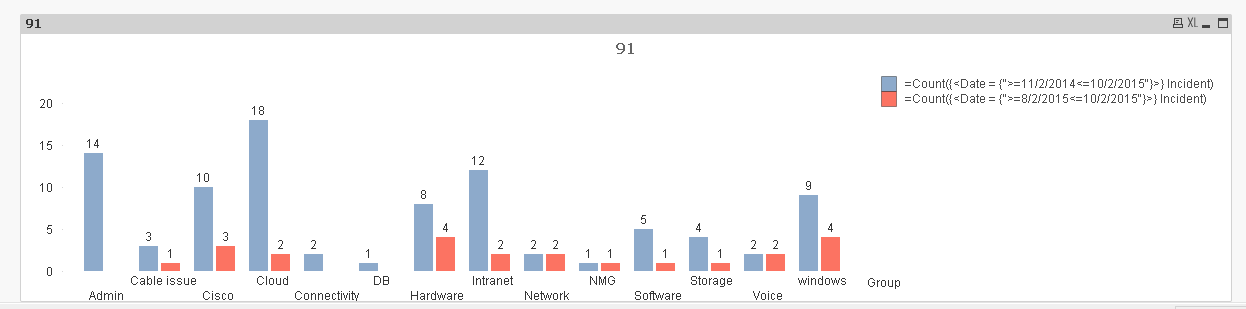
This?
Script:
Table:
LOAD Group,
Incident,
Date as TimeStamp,
Date(Floor(Date)) as Date,
Time(Frac(Date)) as Time
FROM
[Sample year and quarter.xlsx]
(ooxml, embedded labels, table is Sheet1);
Bar Chart:
Dimension: Group
Expressions:
1) =Count({<Date = {"$(='>=' & Date(AddMonths(Max(Date), -11)) & '<=' & Date(Max(Date)))"}>} Incident)
2) =Count({<Date = {"$(='>=' & Date(AddMonths(Max(Date), -2)) & '<=' & Date(Max(Date)))"}>} Incident)
- Mark as New
- Bookmark
- Subscribe
- Mute
- Subscribe to RSS Feed
- Permalink
- Report Inappropriate Content
Thanks Sunny for resolving the issue
- Mark as New
- Bookmark
- Subscribe
- Mute
- Subscribe to RSS Feed
- Permalink
- Report Inappropriate Content
No problem at all 
I am glad I was able to help.
Best,
Sunny
- Mark as New
- Bookmark
- Subscribe
- Mute
- Subscribe to RSS Feed
- Permalink
- Report Inappropriate Content
Hi Sunny,
Sorry for asking again and again
The above query helps me more but can you give me a query by using month field instead of date field.Because i need to rollout a data by using month not date.
Thanks in Advance,
Regards,
Chinnu.
- Mark as New
- Bookmark
- Subscribe
- Mute
- Subscribe to RSS Feed
- Permalink
- Report Inappropriate Content
What is your month field look like?