Unlock a world of possibilities! Login now and discover the exclusive benefits awaiting you.
- Qlik Community
- :
- All Forums
- :
- QlikView App Dev
- :
- Re: Year on Year comparision
- Subscribe to RSS Feed
- Mark Topic as New
- Mark Topic as Read
- Float this Topic for Current User
- Bookmark
- Subscribe
- Mute
- Printer Friendly Page
- Mark as New
- Bookmark
- Subscribe
- Mute
- Subscribe to RSS Feed
- Permalink
- Report Inappropriate Content
Year on Year comparision
Hi All,
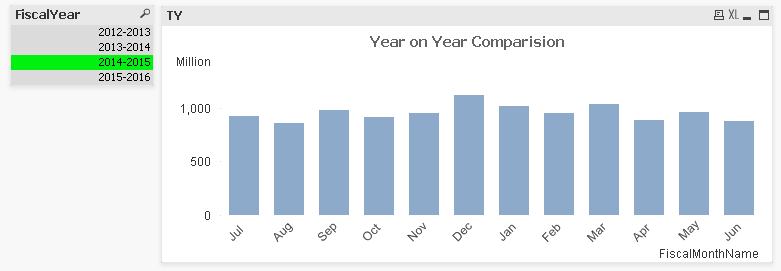
I have two Fiscal Year of Data. lease see following images:


I want to implement the Year on Year comparison in single chart.
For Example if user select 2014-2015 then previous will be 2013-2014. My fiscal year start from July to June like its coming in chart.
Thanks.
- Tags:
- new_to_qlikview
Accepted Solutions
- Mark as New
- Bookmark
- Subscribe
- Mute
- Subscribe to RSS Feed
- Permalink
- Report Inappropriate Content
Follow This:
Create two variables
vCurrent = left(FiscalYear,4)&'-'&(left(FiscalYear,4)+1)
vPrevious = Left(FiscalYear,4)-1&'-'&Left(FiscalYear,4)
Now In Chart Selection FiscalMonth Dimension as you are using the same and write following two expressions:
Current Year: Sum({<FiscalYear={'$(vCurrent)'}>} <Your Field>)
Previous: Sum({<FiscalYear={'$(vPrevious)'}>} <Your Field>)
Hope This will work.
JS
- Mark as New
- Bookmark
- Subscribe
- Mute
- Subscribe to RSS Feed
- Permalink
- Report Inappropriate Content
Try to use these expressions;
For Current Year: Sum({<FiscalYear={$(=Max(FiscalYear))}>} DataField)
For Previous Year: Sum({<FiscalYear={$(=Max(FiscalYear)-1)}>} DataField)
- Mark as New
- Bookmark
- Subscribe
- Mute
- Subscribe to RSS Feed
- Permalink
- Report Inappropriate Content
Hi Pradip,
I can not use Max(FiscalYear)-1 directly..see Fiscal year format.
- Mark as New
- Bookmark
- Subscribe
- Mute
- Subscribe to RSS Feed
- Permalink
- Report Inappropriate Content
Can you upload some sample data with expected output?
- Mark as New
- Bookmark
- Subscribe
- Mute
- Subscribe to RSS Feed
- Permalink
- Report Inappropriate Content

See the image its is showing the selected year...I want to add one more line in the same chart for previous Year.
Sample file is attached. But please share the script as I am using Personal Edition.
- Mark as New
- Bookmark
- Subscribe
- Mute
- Subscribe to RSS Feed
- Permalink
- Report Inappropriate Content
Any Suggestions Plz.
- Mark as New
- Bookmark
- Subscribe
- Mute
- Subscribe to RSS Feed
- Permalink
- Report Inappropriate Content
PFA. Hope it will help.
- Mark as New
- Bookmark
- Subscribe
- Mute
- Subscribe to RSS Feed
- Permalink
- Report Inappropriate Content
- Mark as New
- Bookmark
- Subscribe
- Mute
- Subscribe to RSS Feed
- Permalink
- Report Inappropriate Content
Follow This:
Create two variables
vCurrent = left(FiscalYear,4)&'-'&(left(FiscalYear,4)+1)
vPrevious = Left(FiscalYear,4)-1&'-'&Left(FiscalYear,4)
Now In Chart Selection FiscalMonth Dimension as you are using the same and write following two expressions:
Current Year: Sum({<FiscalYear={'$(vCurrent)'}>} <Your Field>)
Previous: Sum({<FiscalYear={'$(vPrevious)'}>} <Your Field>)
Hope This will work.
JS
- Mark as New
- Bookmark
- Subscribe
- Mute
- Subscribe to RSS Feed
- Permalink
- Report Inappropriate Content
Alternatively you could use 2 lists boxes corresponding to different alternate states and then call
State A from expression 1
State B from expression 2
this way you could compare any 2 years and aren't locked in year and year -1