Unlock a world of possibilities! Login now and discover the exclusive benefits awaiting you.
- Qlik Community
- :
- All Forums
- :
- QlikView App Dev
- :
- Re: Year to Date calculation query
- Subscribe to RSS Feed
- Mark Topic as New
- Mark Topic as Read
- Float this Topic for Current User
- Bookmark
- Subscribe
- Mute
- Printer Friendly Page
- Mark as New
- Bookmark
- Subscribe
- Mute
- Subscribe to RSS Feed
- Permalink
- Report Inappropriate Content
Year to Date calculation query
Hello All,
I have a requirement to create a Year to date view of a ticket data coming in. It is a cumulative request and the ticket count should keep accumulating based on the tickets logged each month. If for a particular month there is no ticket details logged, the previous months count should be displayed as is. The counts should be reset at the beginning of every new year. I have created a chart based on the requirements, but I am facing an issue in the scenario wherein if for a particular month there are no tickets logged, no value is being displayed. Please refer to the chart below :
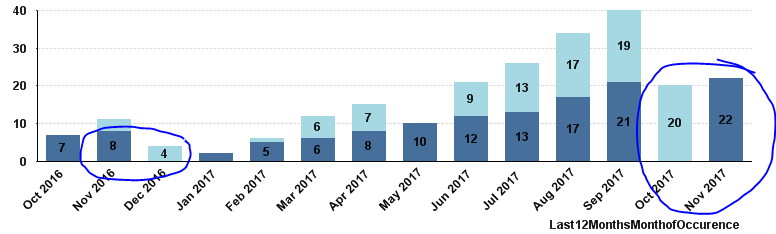
In the chart as you can see, there were no tickets logged for the dark blue section in the month of Dec'16, and the view showing up is incorrect. Similarly for Oct'17. The expression being used is as follows : Aggr(RangeSum(Above(Count(DISTINCT{<,[Nature Of Impact]={'Direct'},[Impact Type]={'High'},[Ticket Number]-={'0'}>}[Ticket Number]),0,RowNo())),Year,MonthofOccurence)
Could you please help out with this issue?
- « Previous Replies
-
- 1
- 2
- Next Replies »
- Mark as New
- Bookmark
- Subscribe
- Mute
- Subscribe to RSS Feed
- Permalink
- Report Inappropriate Content
Looks like you doesn't have Accumulated value. Can you attach the file to test
- Mark as New
- Bookmark
- Subscribe
- Mute
- Subscribe to RSS Feed
- Permalink
- Report Inappropriate Content
How about this
Aggr(RangeSum(Above(Count(DISTINCT{<,[Nature Of Impact] = {'Direct'}, [Impact Type] = {'High'}, [Ticket Number] -= {'0'}>} [Ticket Number]) + Sum({1} 0), 0, RowNo())), Year, MonthofOccurence)
- Mark as New
- Bookmark
- Subscribe
- Mute
- Subscribe to RSS Feed
- Permalink
- Report Inappropriate Content
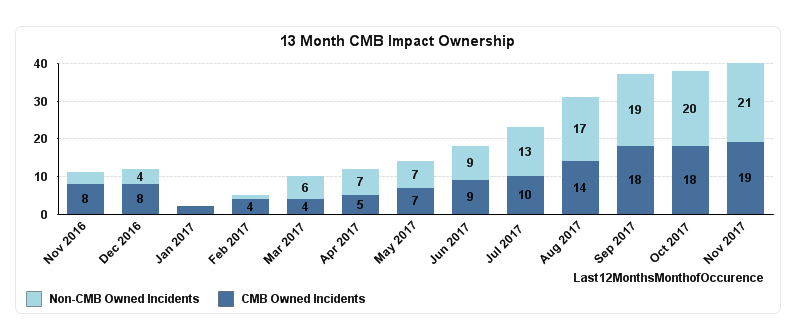
For your reference.
- Mark as New
- Bookmark
- Subscribe
- Mute
- Subscribe to RSS Feed
- Permalink
- Report Inappropriate Content
Does this look right?
- Mark as New
- Bookmark
- Subscribe
- Mute
- Subscribe to RSS Feed
- Permalink
- Report Inappropriate Content
Hi Sunny, this expression worked perfectly. Thanks a lot. Could you please explain this expression, as I couldn't figure out what was wrong ?
- Mark as New
- Bookmark
- Subscribe
- Mute
- Subscribe to RSS Feed
- Permalink
- Report Inappropriate Content
Just added a dummy value for all those MonthYears where they were null because of your set analysis.... the dummy value is Sum({1} 0) which allows you to accumulate as the value for the month year is now 0 instead of null.
- Mark as New
- Bookmark
- Subscribe
- Mute
- Subscribe to RSS Feed
- Permalink
- Report Inappropriate Content
Great, thanks a lot.
- « Previous Replies
-
- 1
- 2
- Next Replies »