Unlock a world of possibilities! Login now and discover the exclusive benefits awaiting you.
- Qlik Community
- :
- All Forums
- :
- QlikView App Dev
- :
- Re: YoY (Year over year growth) by month
- Subscribe to RSS Feed
- Mark Topic as New
- Mark Topic as Read
- Float this Topic for Current User
- Bookmark
- Subscribe
- Mute
- Printer Friendly Page
- Mark as New
- Bookmark
- Subscribe
- Mute
- Subscribe to RSS Feed
- Permalink
- Report Inappropriate Content
YoY (Year over year growth) by month
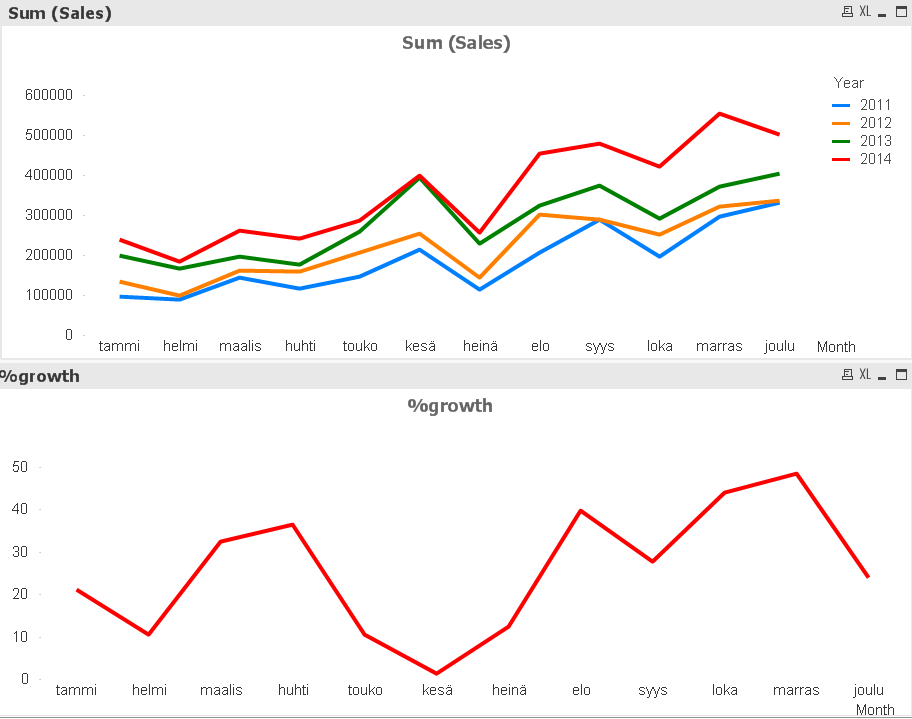
I'm trying to accomplish calculating and visualizing YoY growth. I can get the growth from the previous year to the max year (eg 2013 -> 2014, bottom graph) with this:
=((sum({$<Year = {$(=max(Year))}>}Sales) - sum({$<Year ={$(=max(Year)-1)}>}Sales))/ sum({$<Year = {$(=max(Year)-1)}>}Sales)) * 100
...but what would be the function to get it for all the years in the past (here: 2011 -> 2012 & 2012 -> 2013)?
- « Previous Replies
- Next Replies »
Accepted Solutions
- Mark as New
- Bookmark
- Subscribe
- Mute
- Subscribe to RSS Feed
- Permalink
- Report Inappropriate Content
Hi Elina,
As already mentioned by sunindia, and me, One expression will give your expected resut.
i.e =(sum(Sales)/Above(sum(Sales))-1)
(format should be Fixed to : 2 and Checked the Shown in Percent (%) in Number Tab
Dimensions: Month and Year
Sort : Month and Year as Ascending
Check the Attachment...
- Mark as New
- Bookmark
- Subscribe
- Mute
- Subscribe to RSS Feed
- Permalink
- Report Inappropriate Content
It is difficult to give any recommendation without looking at data, but may be add Year as a dimension and use above function to achieve what you are looking for.
- Mark as New
- Bookmark
- Subscribe
- Mute
- Subscribe to RSS Feed
- Permalink
- Report Inappropriate Content
hi basically you can create more expressions like
=((sum({$<Year = {$(=max(Year)-1)}>}Sales) - sum({$<Year ={$(=max(Year)-2)}>}Sales))/ sum({$<Year = {$(=max(Year)-2)}>}Sales)) * 100
and so on .
for the number of years you want to display
- Mark as New
- Bookmark
- Subscribe
- Mute
- Subscribe to RSS Feed
- Permalink
- Report Inappropriate Content
addyears() may be an option, like:
addyear(max(YearField),0) - Max Year
addyear(max(YearField),-1) - Last Year
addyear(max(YearField),-2) - Last to Last Year
and so on...
- Mark as New
- Bookmark
- Subscribe
- Mute
- Subscribe to RSS Feed
- Permalink
- Report Inappropriate Content
Hi,
May be you can try as below three expression with 2014-2013, 2013-2012, 2012-2011 as labels accordingly for below expression:
=((sum({$<Year = {$(=max(Year))}>}Sales) - sum({$<Year ={$(=max(Year)-1)}>}Sales))/ sum({$<Year = {$(=max(Year)-1)}>}Sales)) * 100
=((sum({$<Year = {$(=max(Year)-1)}>}Sales) - sum({$<Year ={$(=max(Year)-2)}>}Sales))/ sum({$<Year = {$(=max(Year)-2)}>}Sales)) * 100
=((sum({$<Year = {$(=max(Year)-2)}>}Sales) - sum({$<Year ={$(=max(Year)-3)}>}Sales))/ sum({$<Year = {$(=max(Year)-3)}>}Sales)) * 100
- Mark as New
- Bookmark
- Subscribe
- Mute
- Subscribe to RSS Feed
- Permalink
- Report Inappropriate Content
Thanks so much Sunny, Liron, Balraj and Devanand for your quick replys.
So as I understand you all propose to build a function on year by year basis... So there is no generalizable solution, command etc that would run the same calculation across all years no matter how many years?
In Tableau this is accomplished with Quick Table Calculations
Is there something similar in Qlik?
- Mark as New
- Bookmark
- Subscribe
- Mute
- Subscribe to RSS Feed
- Permalink
- Report Inappropriate Content
I think there is a way, but need to be tested on your data. Is it possible to provide a sample?
- Mark as New
- Bookmark
- Subscribe
- Mute
- Subscribe to RSS Feed
- Permalink
- Report Inappropriate Content
Sure. The sample data set can be found from here: https://community.tableau.com/servlet/JiveServlet/download/364331-59869/Sample%20-%20Superstore%20Su...
- Mark as New
- Bookmark
- Subscribe
- Mute
- Subscribe to RSS Feed
- Permalink
- Report Inappropriate Content
Here is how you can do it.
Step 1: Sort your data in the script
This is what I believe you data will be sorted:
Year, Month
2010, Jan
2010, Feb
2010, Mar
2010, Apr
.
.
.
.
2011, Jan
2011, Feb
.
.
.
You need to change the sort order to this:
Year, Month
2010, Jan
2011, Jan
2012, Jan
2013, Jan
.
.
.
2010, Feb
2011, Feb
.
.
.
Sample Script:
Table:
LOAD Date,
Year(Date) as Year,
Month(Date) as Month,
MonthName(Date) as MonthYear,
Ceil(Rand() * 100000) as Sales;
LOAD Date(MakeDate(2010, 12, 31) + RecNo()) as Date
AutoGenerate (Today() - MakeDate(2010, 12, 31));
FinalTable:
NoConcatenate
LOAD *
Resident Table
Order By Month, Year; // Needed sorting is done in a resident load
DROP Table Table;
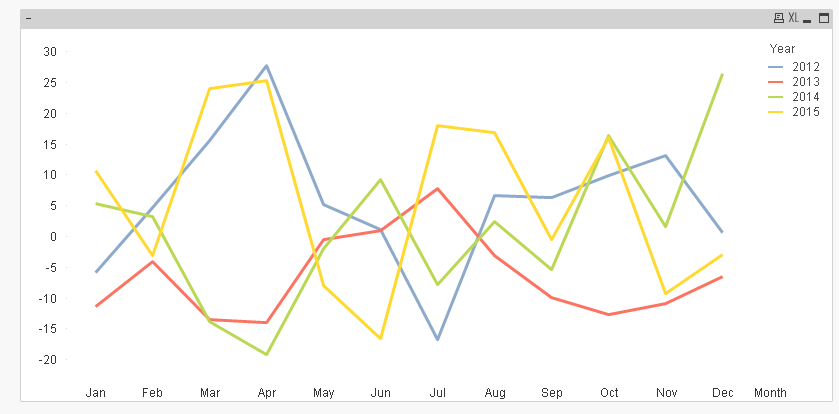
On the front end create a line chart with Month and Year as dimension and use this as your expression:
=Aggr(((Sum(Sales)/Above(Sum(Sales))) - 1) * 100, Month, Year)
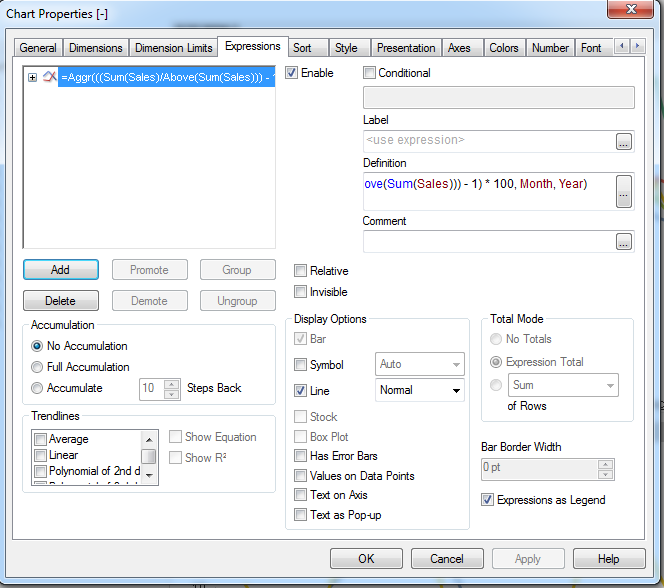
Again note, this will only work if you have correct sorting.
- Mark as New
- Bookmark
- Subscribe
- Mute
- Subscribe to RSS Feed
- Permalink
- Report Inappropriate Content
May be this?
Put your 'Year' Field also into your dimension and try to create your single expression like
=Sum(Sales)/Above(Sum(Sales))-1
check the sample.. may be helps
- « Previous Replies
- Next Replies »