Unlock a world of possibilities! Login now and discover the exclusive benefits awaiting you.
- Qlik Community
- :
- All Forums
- :
- QlikView App Dev
- :
- Re: YoY (Year over year growth) by month
- Subscribe to RSS Feed
- Mark Topic as New
- Mark Topic as Read
- Float this Topic for Current User
- Bookmark
- Subscribe
- Mute
- Printer Friendly Page
- Mark as New
- Bookmark
- Subscribe
- Mute
- Subscribe to RSS Feed
- Permalink
- Report Inappropriate Content
YoY (Year over year growth) by month
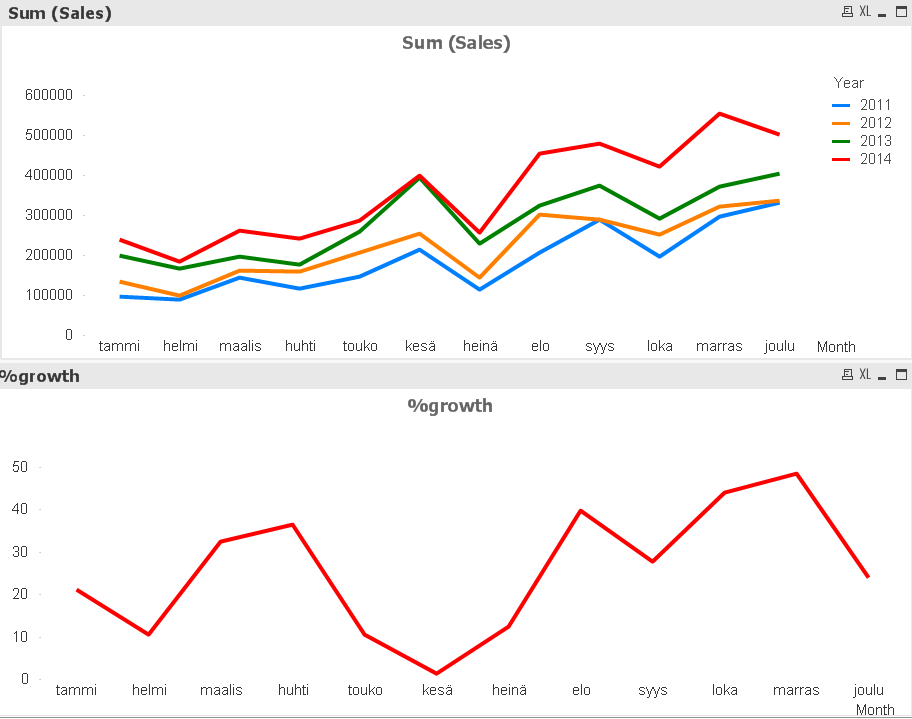
I'm trying to accomplish calculating and visualizing YoY growth. I can get the growth from the previous year to the max year (eg 2013 -> 2014, bottom graph) with this:
=((sum({$<Year = {$(=max(Year))}>}Sales) - sum({$<Year ={$(=max(Year)-1)}>}Sales))/ sum({$<Year = {$(=max(Year)-1)}>}Sales)) * 100
...but what would be the function to get it for all the years in the past (here: 2011 -> 2012 & 2012 -> 2013)?
- « Previous Replies
- Next Replies »
- Mark as New
- Bookmark
- Subscribe
- Mute
- Subscribe to RSS Feed
- Permalink
- Report Inappropriate Content
Thanks so much Sunny for looking into this! Your answer works, but I marked Settu's answer as the solution since it is so compact (less code).
- Mark as New
- Bookmark
- Subscribe
- Mute
- Subscribe to RSS Feed
- Permalink
- Report Inappropriate Content
Thanks Settu!
Only now that Sunny put his solution did I notice that your solution did it. I previously forgot to put the Year into dimensions.
- Mark as New
- Bookmark
- Subscribe
- Mute
- Subscribe to RSS Feed
- Permalink
- Report Inappropriate Content
Hello Settu,
What -1 is doing?
Thank you!
- « Previous Replies
- Next Replies »