Unlock a world of possibilities! Login now and discover the exclusive benefits awaiting you.
- Qlik Community
- :
- All Forums
- :
- QlikView App Dev
- :
- Re: Zeros in pivot table and charts but surpress w...
- Subscribe to RSS Feed
- Mark Topic as New
- Mark Topic as Read
- Float this Topic for Current User
- Bookmark
- Subscribe
- Mute
- Printer Friendly Page
- Mark as New
- Bookmark
- Subscribe
- Mute
- Subscribe to RSS Feed
- Permalink
- Report Inappropriate Content
Zeros in pivot table and charts but surpress when value is null is unchecked
Hi,
I have no zeros in my pivot tables and charts but surpress when value is null is unchecked so I expected to see them?
I am using a crosstable import from excel.
Is there another setting?
Thanks,
Neil.
- Tags:
- new_to_qlikview
- « Previous Replies
-
- 1
- 2
- Next Replies »
Accepted Solutions
- Mark as New
- Bookmark
- Subscribe
- Mute
- Subscribe to RSS Feed
- Permalink
- Report Inappropriate Content
Is this what you want?
Forced your second expression to be null when its 0 using this expression:
=If(Sum({<Measure={'Amber Threshold'}>}Data) <> 0, Sum({<Measure={'Amber Threshold'}>}Data))
Is that what you wanted? Attaching your qvw for reference as well.
HTH
Best,
Sunny
- Mark as New
- Bookmark
- Subscribe
- Mute
- Subscribe to RSS Feed
- Permalink
- Report Inappropriate Content
Ok got it:
In presentation tab uncheck surpress zeros
In diminsion tab check surpress when value is null
- Mark as New
- Bookmark
- Subscribe
- Mute
- Subscribe to RSS Feed
- Permalink
- Report Inappropriate Content
Hi Neil,
there's this one on the presentation tab too!
HTH - Andy
- Mark as New
- Bookmark
- Subscribe
- Mute
- Subscribe to RSS Feed
- Permalink
- Report Inappropriate Content
Thanks,
I wrote before I tested on a chart, maybe you can help here.
If there is a zero I want the dimension, like a date to plot, but of course no value will show up.
But if the value is null I dont want a plot either but I am getting them with.
So I am a bir lost as to why nulls are plotting but zeros are not
- Mark as New
- Bookmark
- Subscribe
- Mute
- Subscribe to RSS Feed
- Permalink
- Report Inappropriate Content
most likely it has to do with your expressions and dimensions
can you post a sample app?
- Mark as New
- Bookmark
- Subscribe
- Mute
- Subscribe to RSS Feed
- Permalink
- Report Inappropriate Content
I have a attached a QVW,
I want the zero to trigger having the date in the x axis but dont plot blank data.
The legend can stay on, this is to future proof a potential change.
- Mark as New
- Bookmark
- Subscribe
- Mute
- Subscribe to RSS Feed
- Permalink
- Report Inappropriate Content
If you want to plot zero, uncheck the "Suppress zero" in presenation and if you don't want to plot the null value, check the "Suppress when null value" check box.
- Mark as New
- Bookmark
- Subscribe
- Mute
- Subscribe to RSS Feed
- Permalink
- Report Inappropriate Content
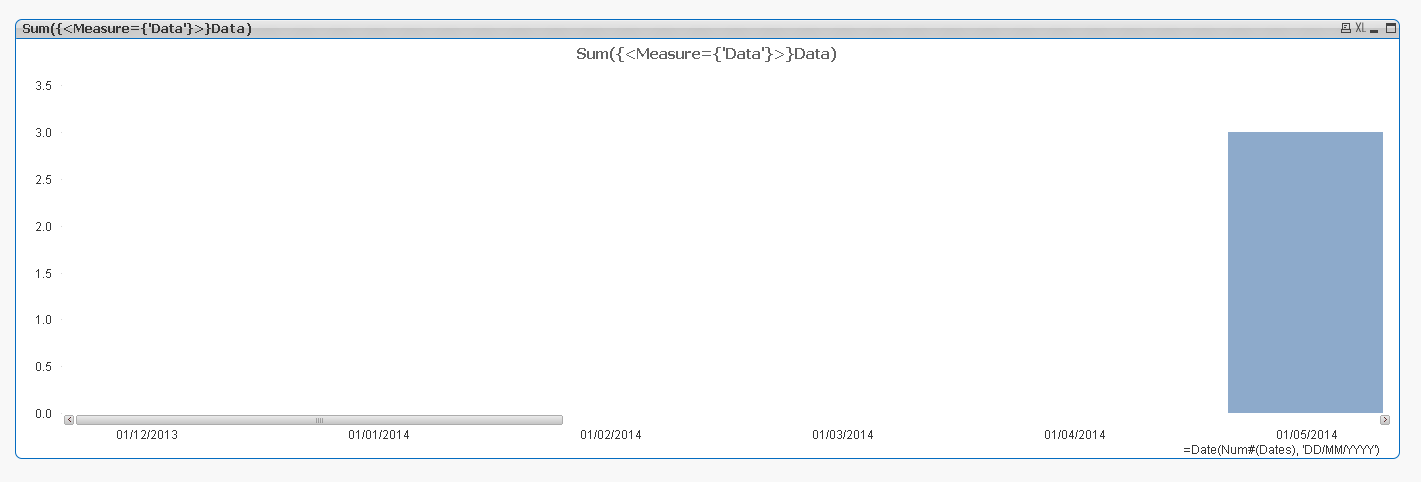
Hi Neil.
from the sample app I can see that it works as expected. You do not have any missing data (no null values in field Data) only zero or above zero.
I am really not sure what the problem is. See the image below

- Mark as New
- Bookmark
- Subscribe
- Mute
- Subscribe to RSS Feed
- Permalink
- Report Inappropriate Content
There is another line measure call amber threshold that is all nulls, does that not show iun the QVW.
This is the meaure that I want to future proof, if its null I dont want to show the line, is it on your chart?
- Mark as New
- Bookmark
- Subscribe
- Mute
- Subscribe to RSS Feed
- Permalink
- Report Inappropriate Content
Ok so that looks like a table box.
So have I forced the pivot table and chart to do something when I do an expression
Sum({<Measure={'Amber Threshold'}>}Data)
But Amber Threshold is not there according to the table box, so SUM is ploting on the chart, but its an error?
- « Previous Replies
-
- 1
- 2
- Next Replies »