Unlock a world of possibilities! Login now and discover the exclusive benefits awaiting you.
- Qlik Community
- :
- All Forums
- :
- QlikView App Dev
- :
- Re: aggr(sum(total <$(ColumnDim_p)> sales) How to ...
- Subscribe to RSS Feed
- Mark Topic as New
- Mark Topic as Read
- Float this Topic for Current User
- Bookmark
- Subscribe
- Mute
- Printer Friendly Page
- Mark as New
- Bookmark
- Subscribe
- Mute
- Subscribe to RSS Feed
- Permalink
- Report Inappropriate Content
aggr(sum(total <$(ColumnDim_p)> sales) How to replace with rEVENUE ?
Hi All
I have expression as below work fine for chart 1:-
sum({$<year = {"<=$(=max(year)) >=$(=max(year)-12)"}, month = {"<=$(=max({<year={$(=max(year))}>} month))"}>} $(ColumnDim51)/1000/$(Columndim89))
I also have expression below work fine for chart 2 :-
sum({$<year = {"<=$(=max(year)) >=$(=max(year)-12)"}, month = {"<=$(=max({<year={$(=max(year))}>} month))"}>} $(ColumnDim601)/1000/$(Columndim89))
when user select Dim2 = rEVENUE , I have convert the above expression to below , and this expression i insert at Chart 3 :-
sum({$<year = {"<=$(=max(year)) >=$(=max(year)-12)"}, month = {"<=$(=max({<year={$(=max(year))}>} month))"}>} rEVENUE={rEVENUE}>}Amount/1000/$(Columndim89))
Chart 3 Dimension expression as below :-
=if(aggr(sum(sales),$(ColumnDim101)) / aggr(sum(total <$(ColumnDim_p)> sales), $(ColumnDim101)) > 0.00001, $(ColumnDim101), ' Other')
Can some one advise me how to change the above expression sales to rEVENUE ?
So that chart 3 is able to display the bar.
Paul
- Tags:
- qlikview_scripting
Accepted Solutions
- Mark as New
- Bookmark
- Subscribe
- Mute
- Subscribe to RSS Feed
- Permalink
- Report Inappropriate Content
Hi Paul,
I was checking your expression, please check the characters in bold and red:
sum({$<year = {"<=$(=max(year)) >=$(=max(year)-12)"}, month = {"<=$(=max({<year={$(=max(year))}>} month))"}>} rEVENUE={rEVENUE}>}Amount/1000/$(Columndim89))
I just remove those characters (I also added single quotes to your rEVENUE value):
sum({$<year = {"<=$(=max(year)) >=$(=max(year)-12)"}, month = {"<=$(=max({<year={$(=max(year))}>} month))"}, rEVENUE={'rEVENUE'}>}Amount/1000/$(Columndim89))
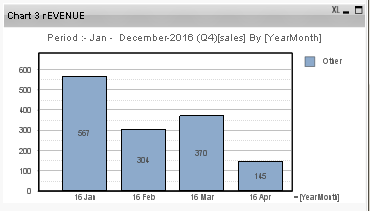
The chart displays the following information, but I'm not sure if this fills your needs:
Regards,
-- Karla
- Mark as New
- Bookmark
- Subscribe
- Mute
- Subscribe to RSS Feed
- Permalink
- Report Inappropriate Content
My QV Doc
- Mark as New
- Bookmark
- Subscribe
- Mute
- Subscribe to RSS Feed
- Permalink
- Report Inappropriate Content
Hi Paul,
I was checking your expression, please check the characters in bold and red:
sum({$<year = {"<=$(=max(year)) >=$(=max(year)-12)"}, month = {"<=$(=max({<year={$(=max(year))}>} month))"}>} rEVENUE={rEVENUE}>}Amount/1000/$(Columndim89))
I just remove those characters (I also added single quotes to your rEVENUE value):
sum({$<year = {"<=$(=max(year)) >=$(=max(year)-12)"}, month = {"<=$(=max({<year={$(=max(year))}>} month))"}, rEVENUE={'rEVENUE'}>}Amount/1000/$(Columndim89))
The chart displays the following information, but I'm not sure if this fills your needs:
Regards,
-- Karla
- Mark as New
- Bookmark
- Subscribe
- Mute
- Subscribe to RSS Feed
- Permalink
- Report Inappropriate Content
Hi Karla
Thank you for your advise . I have test it does give the chart. But due to my dimension expression have some issue , i need to solve it .
Paul